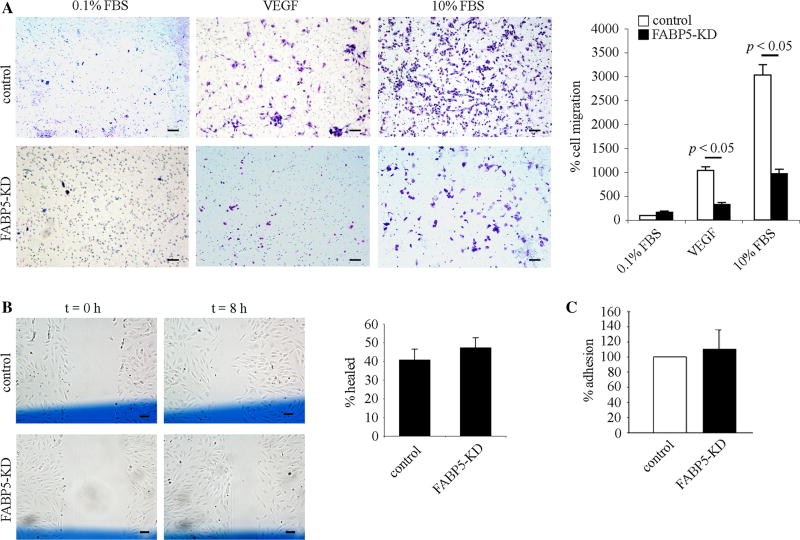
Fig. 3.
FABP5 deficiency attenuates chemotactic migration of endothelial cells. a Representative images of filters stained with Diff-Quick in a transwell cell migration assay. FABP5-KD or control HUVECs were plated in the upper chamber of a transwell at a density of 1 × 10⁵ cells in 0.1 % FBS, ECGF-free medium, and transwell migration was stimulated by addition of VEGF (50 ng/ml) or 10 % FBS to the media in the lower well. EC migration was quantified by counting the number of cells in three random fields per insert at ×100 magnification. Bar graph represents mean ± SEM from three independent experiments. Scale bar 100 µm. b Representative images of a cellular wound assay at 0 and 8 h after wounding. Control and FABP5-KD HUVECs were grown to 70–90 % confluency in 6-well plates. Three vertical scratches were made across each well with a flat-edge forceps. A horizontal reference line (shown in blue color) was drawn to denote the scratch field of view (FOV) at the scratch intersection. Images of the wounded cells were taken above and below the reference line at the scratch/cell interfaces at t = 0 and t = 8 h. The average scratch width was determined for each FOV, and the distance migrated was calculated and expressed as a percentage of the initial scratch width. Bar graph represents mean ± SEM from four independent experiments. Scale bar 100 µm. c Control and FABP5-KD HUVECs were seeded in 96-well plates coated with gelatin at a density of 5 × 10⁴ cells per well and allowed to attach for 1 h. Non-adherent cells were removed by washing in PBS, and adherent cells were fixed and stained in 0.125 % Coomassie Blue. After thorough destaining, the contents of the wells were solubilized in 2 % SDS, and optical density, indicative of adherent cells, was read at 620 nm. Bar graph represents mean ± - SEM from three independent experiments

