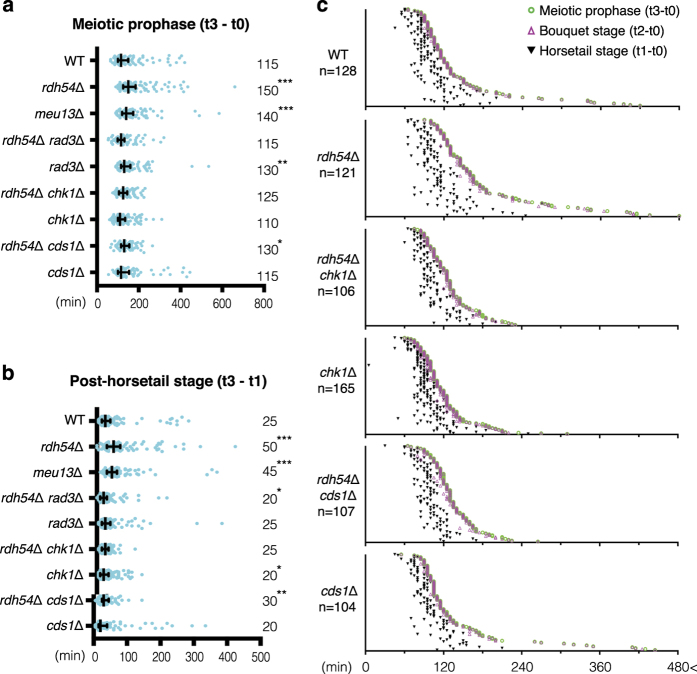
Figure 2.
Rad3/ATR-dependent extension of the bouquet stage. (a, b) Distribution graphs calculated from dot plots in Figures 1e and 2c. Median durations are indicated on the right. The outside bars represent interquartile range. Significant differences over wild type are indicated as asterisks (the Mann–Whitney nonparametric test: * at P<0.05, ** at P<0.01 and *** at P<0.001). (a) Duration of meiotic prophase [t3–t0]. (b) Duration of the post-horsetail stage, which represents the time from SPB settling until entry into meiosis I [t3–t1]. (c) Individual dot plots of meiotic prophase time course in the DNA damage checkpoint mutants. Data for WT and rdh54Δ are taken from Figure 1e. See the graph in Figure 1e for details. For values in each sample, see Supplementary Table S2.

