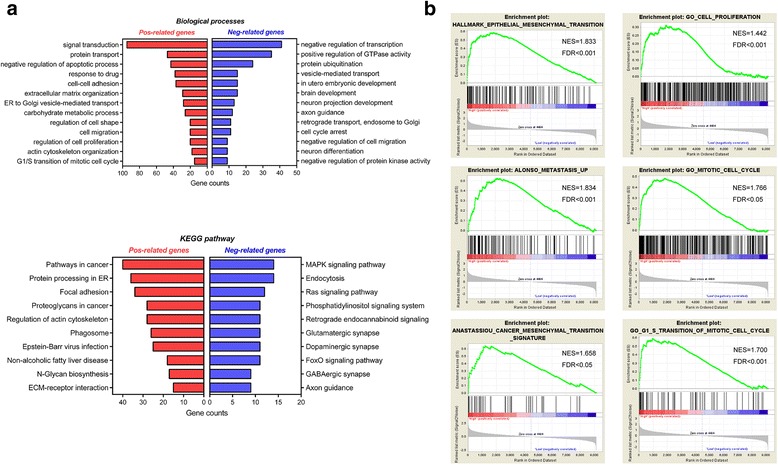
Fig. 2.

Pathway analysis of TAGLN2 and co-regulated genes. a Correlation analysis using TCGA data showing positively (n = 1366) and negatively (n = 822) correlated genes with TAGLN2 mRNA expression in human gliomas. Biological processes and KEGG pathway analysis of the positively and negatively correlated genes are illustrated. Potential functions and pathways are listed on the Y-axis. b GSEA highlighting positive association of increased TAGLN2 expression levels with EMT, cancer metastasis, cell proliferation, and G1-S phase transition of cell cycle progression. FDR = false discovery rate; NES = normalized enrichment score
