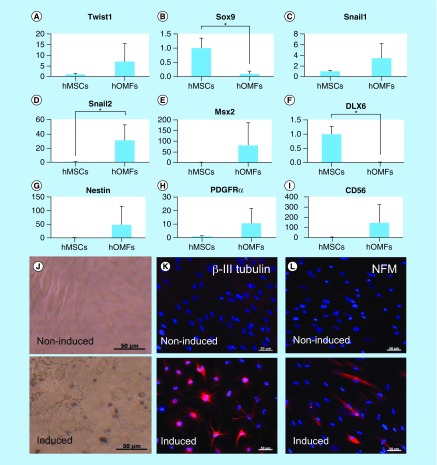
Figure 4. . Expression of early neural crest (Twist1, Sox9, Snail1 and Snail2), ectomesenchymal (MSX2 and DLX6) and neural markers.
(A–I) Real-time PCR of early neural crest (Twist1, Sox9, Snail1, Snail2, CD56 and PDGFRα), ectomesenchymal (MSX2 and DLX6) and neural stem cell (nestin) markers. Y-axis indicates relative expression compared with the control group levels (hMSCs), which were normalized to 1. Error bars indicate SD (n = 4). (J) Phase-contrast images of noninduced (upper panel) and induced (lower) hOMFs. (K & L) Immunocytochemical staining of βIII-tubulin (K) and NFM (L). Noninduced (upper panel) and induced (lower) hOMFs. Nuclei were stained with 4′,6-Diamidino-2-phenylindole (DAPI). Scale bars: 50 μm.
hMSC: Human mesenchymal stem cell; hOMF: Human oral mucosa middle interstitial tissue fibroblast; NFM: Neurofilament medium.

