
Figure 1.
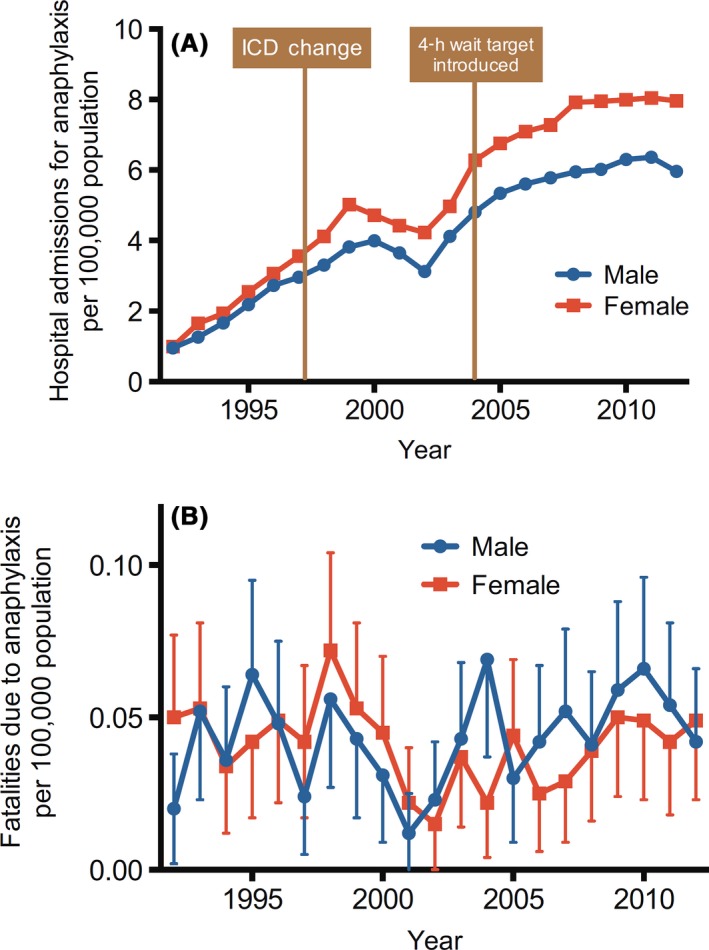
Time trends of hospital admissions (A) and fatalities (B) for all‐cause anaphylaxis in the UK between 1992 and 2012. Vertical bars represent standard error of the means.6
Official websites use .gov
A
.gov website belongs to an official
government organization in the United States.
Secure .gov websites use HTTPS
A lock (
) or https:// means you've safely
connected to the .gov website. Share sensitive
information only on official, secure websites.
Time trends of hospital admissions (A) and fatalities (B) for all‐cause anaphylaxis in the UK between 1992 and 2012. Vertical bars represent standard error of the means.6