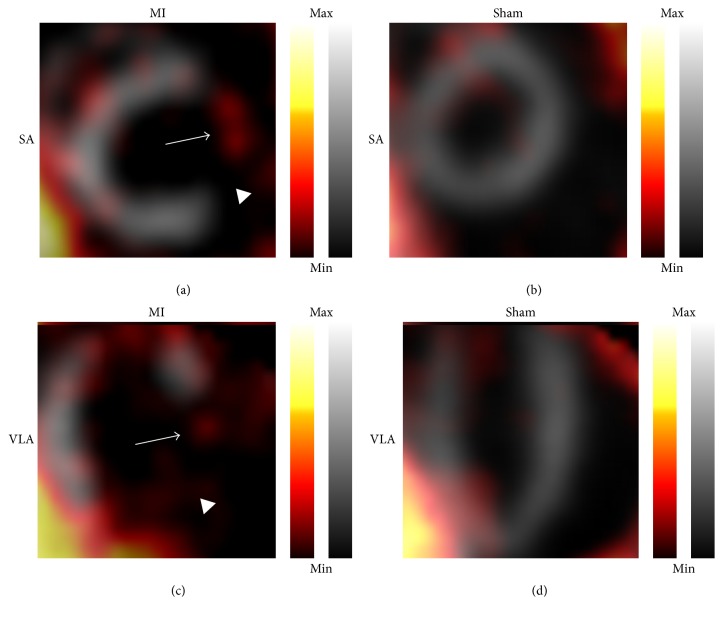
Figure 6.
Representative in vivo fusion images of 99mTc-sestamibi and co(NGR)4 uptake. In “grey” is the uptake of 99mTc-sestamibi in myocardium, while uptake of co(NGR)4 imaging is in “hot metal” color. (a) and (c): infarcted heart. Infarct area is signified by decreased uptake of 99mTc-sestamibi which is clearly visible in the anterolateral region of the heart (arrowheads). Enhanced uptake of co(NGR)4 is clearly visibly in the infarct area (arrows). (b) and (d): sham-operated heart. Uniform uptake of 99mTc-sestamibi can be seen in combination with low overall uptake of co(NGR)4. Note: uptake is color coded and relative to injected dose per animal. SA: short axis; VLA: vertical long axis.

