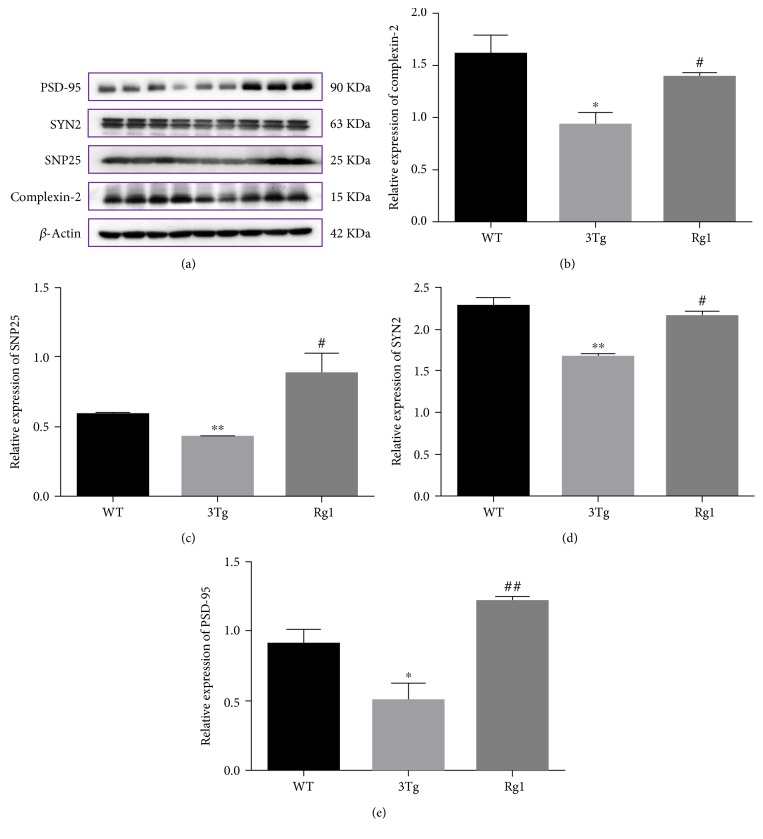
Figure 8.
Validation of differentially expressed proteins of CPLX2, SNP25, and SYN2 by Western blot analysis. (a and b) The relative levels of CPLX2 in the hippocampus in WT mice, nontreated 3xTg-AD mice, and Rg1-treated 3xTg-AD mice. (a and c) The relative levels of SNP25 in the hippocampus in WT mice, nontreated 3xTg-AD mice, and Rg1-treated 3xTg-AD mice. (a and d) The relative levels of SYN2 in the hippocampus in WT mice, nontreated 3xTg-AD mice, and Rg1-treated 3xTg-AD mice. (a and e) The relative levels of PSD-95 in the hippocampus in WT mice, nontreated 3xTg-AD mice, and Rg1-treated 3xTg-AD mice. The data were presented as mean ± SEM. ∗p < 0.05 and ∗∗p < 0.01 versus WT; #p < 0.05 and ##p < 0.01 versus 3Tg. n = 3 for each group.

