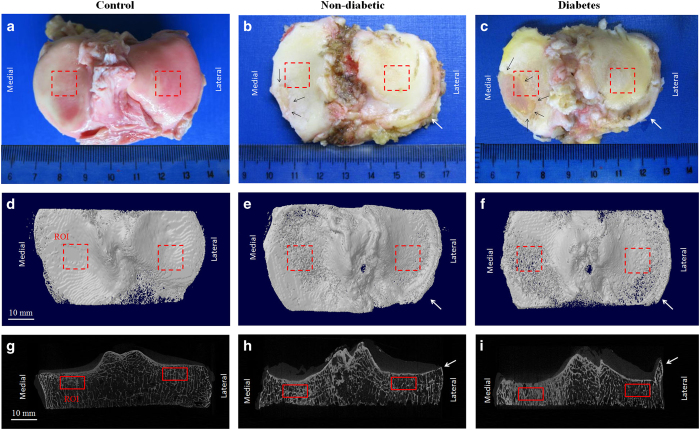
Figure 1.
Macroscopic and micro-CT images of tibial plateaus from non-diabetic and diabetes patients. Macroscopic images were shown in (a–c). Black arrows (b,c) indicated edges of the remained cartilage in OA specimens. The corresponding micro-CT images were displayed in (d–f) (top view) and (g–i) (coronal view), with the red rectangles indicating the ROIs of subchondral bone (solid lines) and subchondral plate (dashed lines) on medial and lateral sides. White arrows (b,c,e,f,h,i) indicate osteophytes in non-diabetic and diabetes groups.

