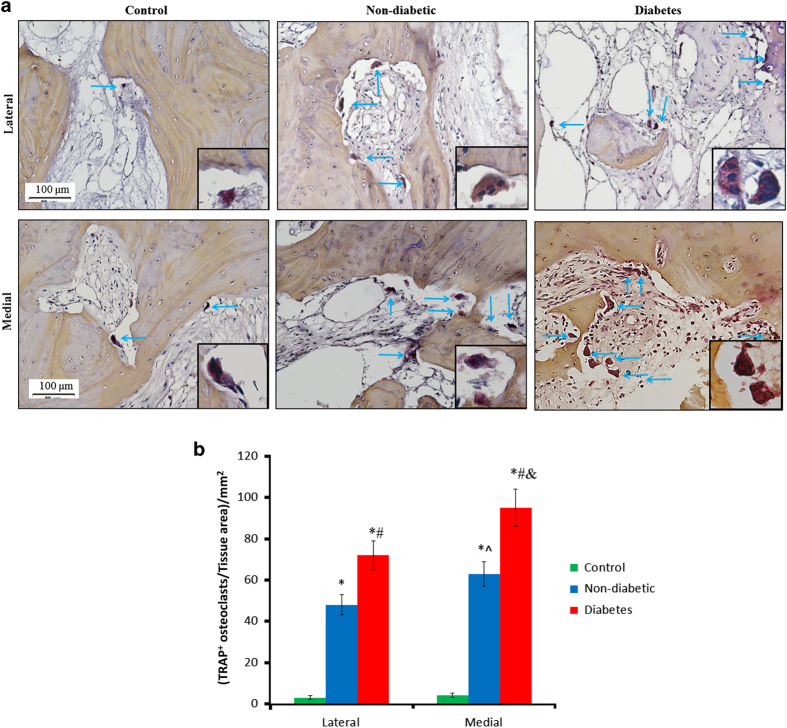
Figure 4.
Activity of TRAP+ osteoclasts in subchondral bone from non-diabetic and diabetes patients. (a) Diabetes group generated larger bone marrow cavities than non-diabetic group on both lateral and medial sides. (b) One-way ANOVA analysis showed that there were significant differences in TRAP+ osteoclasts among groups on both sides. Of note, the number of TRAP+ osteoclasts in diabetes group was higher than non-diabetic group. In addition, the numbers of TRAP+ osteoclasts on medial sides were higher than lateral sides in both non-diabetic and diabetes group. Insert: morphology of TRAP+ osteoclasts. #P<0.05 vs non-diabetic group and *P<0.05 vs control group on the same side according to Post-hoc tests; ^P<0.05 between lateral and medial sides in non-diabetic group; &P<0.05 between lateral and medial sides in diabetic group.

