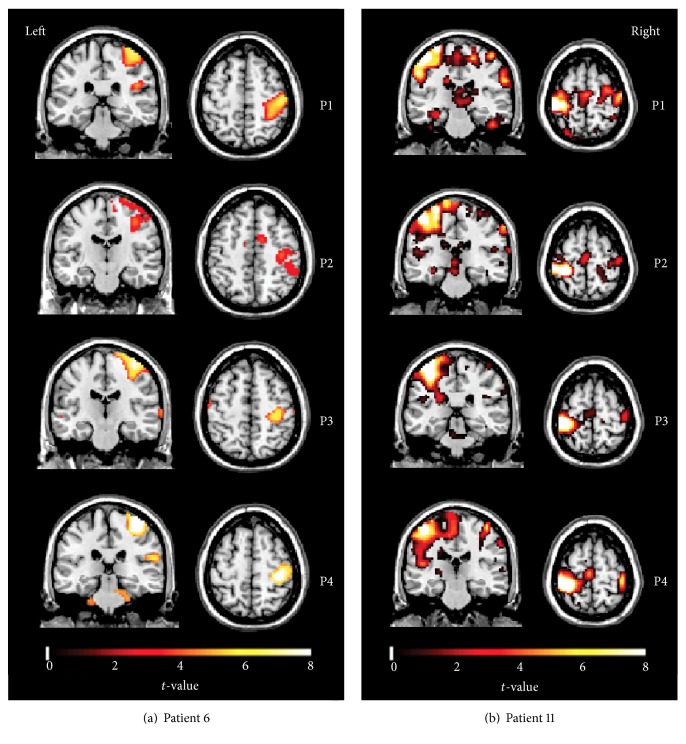
Figure 2.
Activation of patient number 6 (a) and patient number 11 (b) while they were performing the finger-tapping task with the affected hands (left hand for patient number 6; right hand for patient number 11) at four time points after stroke (p < 0.001, extent threshold = 13 voxels). Colorbar represents the t-value. Both patients had lesions in basal ganglia.

