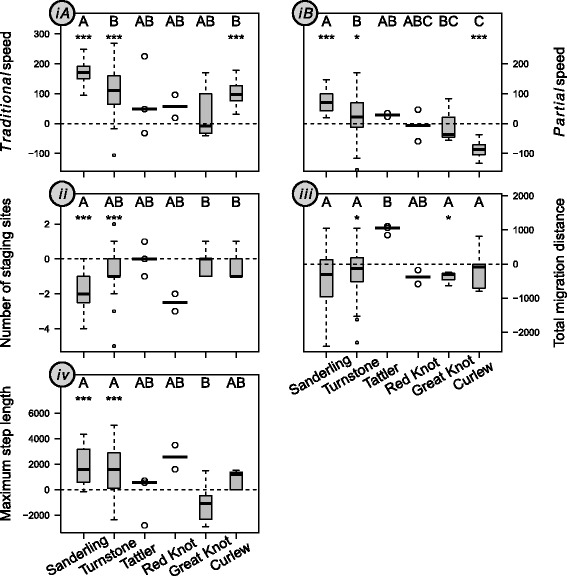
Fig. 2.

Seasonal difference in four migratory variables for six EAAF migratory sandpipers. Seasonal difference was based on subtracting data for post-breeding from pre-breeding migration for each individual bird. (iA) traditional migration speed (km/d) calculated as the total migration distance divided by total migration duration; (iB) partial migration speed (km/d), dividing migration distance between the first staging site and the wintering/breeding grounds by the total duration from arrival at the first staging site until arrival at the wintering/breeding grounds; (ii) number of staging sites; (iii) total migration distance (km); (iv) the maximum step length (km). Species along the X-axes are ranked in order of increasing lean body mass. The thick line within each box and whisker plot represents the median, and the lower and upper box border represents the first and the third quantile, respectively. Whiskers denote the lower and upper 95% confidence interval. Dots outside the whiskers are outliners above or below the 95% confidence interval. Since only three and two data points were available for Tattler and Red Knot, respectively, the individual data points and the medians are plotted for each of these two species. In all panels a dotted horizontal line representing no seasonal difference is added to assist visual interpretation. For example, in panel (iA) below the zero horizontal line indicates slower pre- compared to post-breeding migration speed, whereas above the line indicates faster pre- compared to post-breeding migration. Seasonal difference within species differences were tested using paired t-tests asterisks identifying significant differences (p < 0.05 ‘*’, p < 0.01 ‘**’, p < 0.001 ‘***’). Between species differences were tested using multiple comparison Games-Howell post-hoc tests and are noted with capital letters, with species not sharing the same letter being significantly different. Liner models showed that only partial migration speed (iB) varies in relation to lean body mass, with post-breeding migration becoming progressively faster relative to pre-breeding migration with an increase in body size
