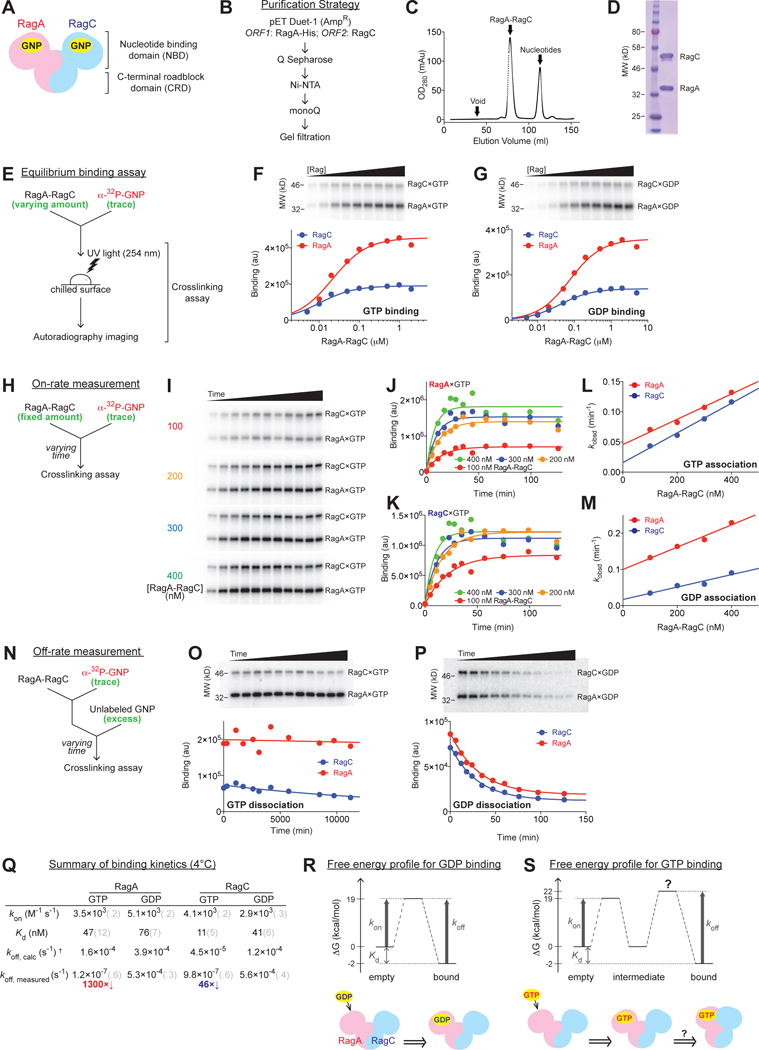
Figure 1. Quantitative measures of the nucleotide binding properties of the Rag GTPases.

(A) General architecture and domain organization of the Rag GTPase heterodimer. GNP: guanosine di/tri-phosphate.
(B) Generation of recombinant Rag GTPases in bacteria.
(C) Elution profile of the Rag GTPase heterodimer on a HiLoad 16/60 Superdex 200 gel-filtration column. After EDTA stripping, the Rag heterodimer separates from its bound nucleotides and emerges as a single peak as indicated.
(D) SDS-PAGE and Coomassie blue staining analysis of purified Rags.
(E) Experimental setup of the crosslinking assay for measuring the nucleotide binding affinity of each Rag subunit.
(F–G) GTP (F) and GDP (G) binding to the Rag GTPases. Top panels: nucleotide bound to RagA (lower bands, MW = 37 kDa) and RagC (upper bands, MW = 44 kDa) visualized by autoradiography. Bottom panels: quantification of the radioactive signals from the top panels. Data were fit to a single-site binding equation to obtain the dissociation constant Kd.
(H) Experimental setup of the crosslinking assay for measuring the on-rates of nucleotides to the Rag GTPases.
(I) Reaction time-course of GTP bound to Rag subunits during an on-rate measurement. Four Rag concentrations (100, 200, 300, and 400 nM) are shown from top to bottom panels, where time points were taken to monitor the reaction process. At higher Rag concentrations, reactions reach equilibrium faster.
(J–K) Quantification of the observed rate constants for GTP association to RagA (J) and RagC (K) at different Rag concentrations. A single exponential rise function was used to fit the time points shown in 1I. Curve colors match with the corresponding Rag concentrations in 1I.
(L–M) On-rates for GTP (L) and GDP (M) to the Rag GTPase heterodimer. Linear regression of the observed rate constants (values obtained from 1J and 1K for GTP association, from Supplementary Figure 1E and 1F for GDP association) against Rag concentration gives the slope (kon) for RagA (red) and RagC (blue).
(N) Experimental setup of the crosslinking assay for measuring the off-rates of nucleotides from the Rag GTPases.
(O–P) Reaction time-course of radioactively labeled nucleotides remaining bound to Rag subunits during the off-rate measurement of GTP (O) and GDP (P) dissociation. Top panels: SDS-PAGE resolves nucleotide bound to RagA (lower bands) and RagC (upper bands) in the presence of unlabeled nucleotides as a chase. Bottom panels: quantification. Data were fit to a single exponential decay to extract the off-rates (koff).
(Q) Summary of binding kinetics of nucleotides to the Rag GTPases at 4 °C. Grey numbers in parenthesis denote the standard deviations of the reported values calculated from at least three independent experiments.
(R–S) Free energy profiles and models for GDP (R) and GTP (S) binding to the Rag GTPases. In the case of GDP binding (R), the matched predicted and measured koff values suggest a single energy barrier. In the case of GTP binding (S), a second barrier is required to explain the discrepancy between the predicted and measured koff values.
