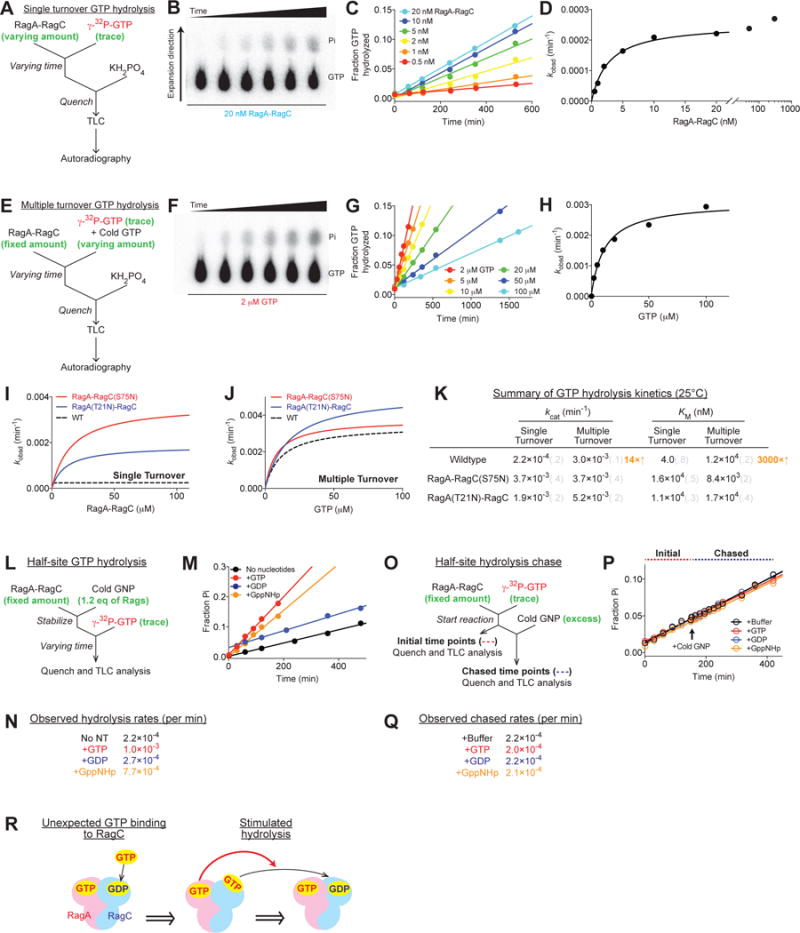
Figure 3. Directional GTP hydrolysis maintains the functional state of the Rag GTPases.

(A and E) Experimental setup for the single (A) and multiple (E) turnover GTP hydrolysis assays. A saturating amount of the Rag GTPases was incubated with a trace amount of labeled GTP to ensure single turnover conditions (A). A saturating amount of GTP was incubated with the Rag GTPases to ensure multiple turnover conditions (E).
(B and F) Thin layer chromatography to separate radioactive phosphate from unhydrolyzed GTP at different time points. 20 nM Rag GTPases hydrolyzed a trace amount of labeled GTP in a single turnover assay (B). 2 μM Rag GTPases hydrolyzed 2 μM GTP in a multiple turnover assay (F).
(C and G) Quantification and linear regression of the fraction of hydrolyzed GTP yields the observed rate constants (kobsd) at different Rag (C) or GTP (G) concentrations.
(D and H) Michaelis-Menten fittings of kobsd against Rag or GTP concentration yield kcat and KM for the single turnover (D) and multiple turnover (H) reactions.
(I–J) Single turnover (I) and multiple turnover (J) GTP hydrolysis reactions for RagA-RagC(S75N) (red circle) and RagA(T21N)-RagC (blue circle). Dashed curves show the activity of wildtype Rags as a reference.
(K) Summary of GTP hydrolysis kinetics for the Rag GTPases at 25°C. Grey numbers in parenthesis denote the standard deviations of the reported values calculated from at least three independent experiments.
(L) Experimental setup for a half-site GTP hydrolysis reaction.
(M) Half-site GTP hydrolysis in the presence of GTP (red), GDP (blue), or GppNHp (orange). Radioactively labeled GTP is hydrolyzed on one subunit of the Rag GTPases when the other is preloaded with nucleotides. Preloaded GTP and GppNHp trigger hydrolysis by the other subunit. Control (black) contains no preloaded nucleotides.
(N) Summary of the observed rate constants for half-site GTP hydrolysis reactions in M.
(O) Experimental setup for a half-site GTP hydrolysis chase. Labeled GTP was preloaded and hydrolyzed on one subunit of the Rag GTPases, before an excess amount of cold nucleotides was added to occupy the remaining binding sites.
(P) Half-site GTP hydrolysis chased by GTP (red), GDP (blue), or GppNHp (orange). No difference in the slope was observed. Pure buffer was added to the control (black).
(Q) Summary of the observed rate constants for half-site GTP hydrolysis chase in P.
(R) Illustration of the effect of the locked conformation on GTP hydrolysis. GTP binding to RagA triggers GTP hydrolysis by RagC. The reverse case is shown in Supplementary Figure 3H.
