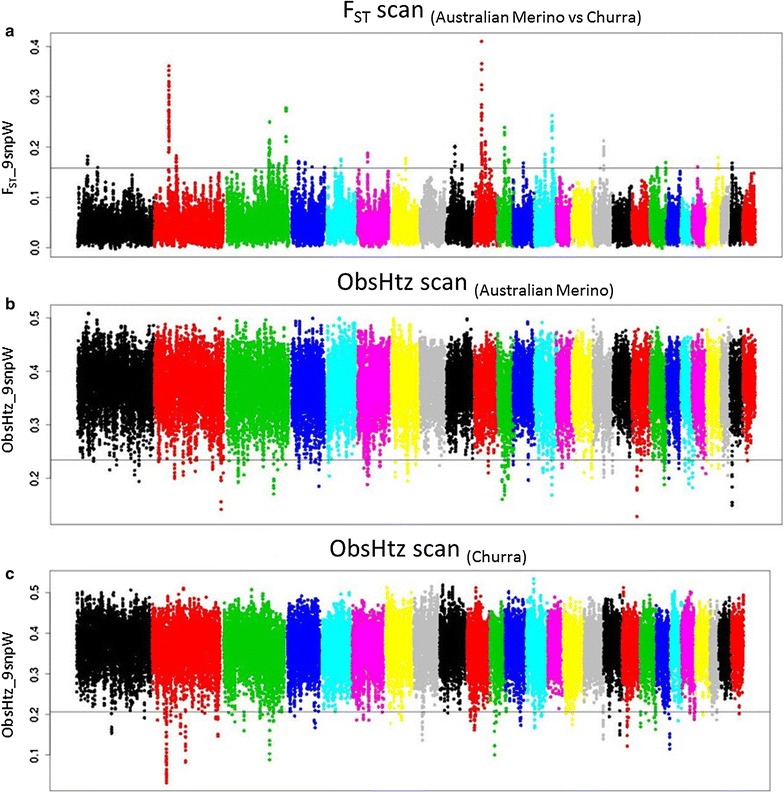
Fig. 2.

Results of the genetic differentiation analysis (a) and of the analysis of reduced heterozygosity in the Australian Merino populations studied here (Australian Industry Merino, Australian Merino and Australian Poll Merino) (b) and Spanish Churra sheepAustralian Merino sheep (c). a F ST values obtained across the whole-genome (averaged in sliding 9-SNP windows) when contrasting the 50 K-chip pooled genotypes of the Australian Merino and Spanish Churra sheep samples considered in this work. The horizontal line indicates the top 0.5th percent threshold of the F ST-distribution. b, c Genome-wide distribution of observed heterozygosity values (averaged over a sliding 9-SNP window) for the pooled genotypes of the three Australian Merino populations (b) and Spanish Churra (c). The horizontal lines indicate the bottom 0.5th percent thresholds of the heterozygosity distributions
