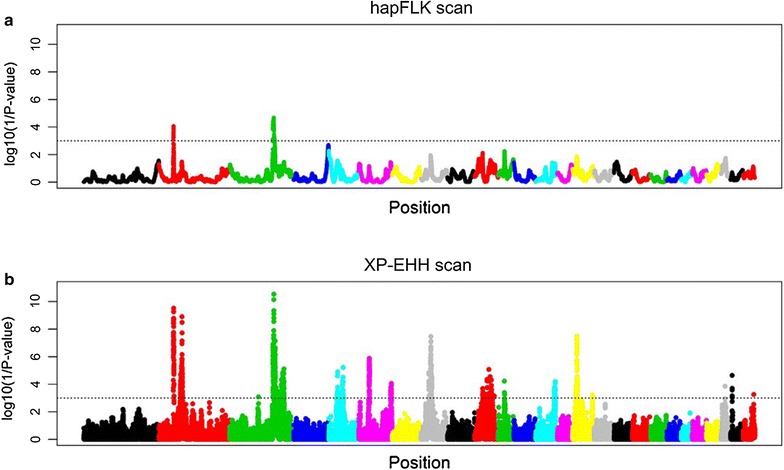
Fig. 3.

Results of the selection sweep mapping analyses performed with the two haplotype-based methods used in this work, performed with the hapFLK (a) and the rehh (XP-EHH analysis) (b) software. Genome-wide distribution of the log (1/P value) obtained from each analysis are represented on the Y-axis. The horizontal lines represent the significance threshold considered (P < 0.001)
