
Fig. 2.
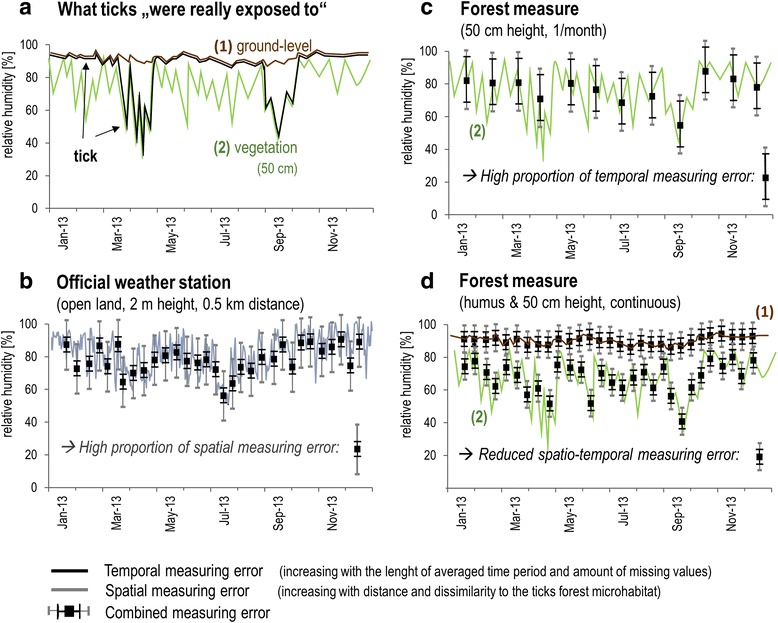
Meteorological data collection methods and connected measuring errors compared to real conditions. A schematic illustration of the measuring errors that exist between real conditions in a tick’s microhabitat (a) brown: RH conditions at ground-level, green: RH conditions in the lower vegetation, black: conditions the tick experienced) and data derived from different measuring concepts (b, c, d). Our concept is schematically illustrated in (b), with measurements taken at ground-level (error bars on brown line) and in 50 cm height (error bars on green line)