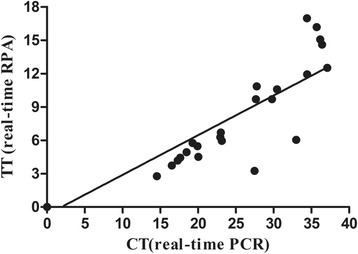
Fig. 3.

Comparisons between results of real-time RPA and real-time PCR on clinical samples. DNA extracts from 34 clinical samples were screened. Linear regression analysis of real-time RPA threshold time (TT) values (y axis) and real-time PCR cycle threshold (CT) values (x axis) were determined using Prism software. R2 value = 0.846
