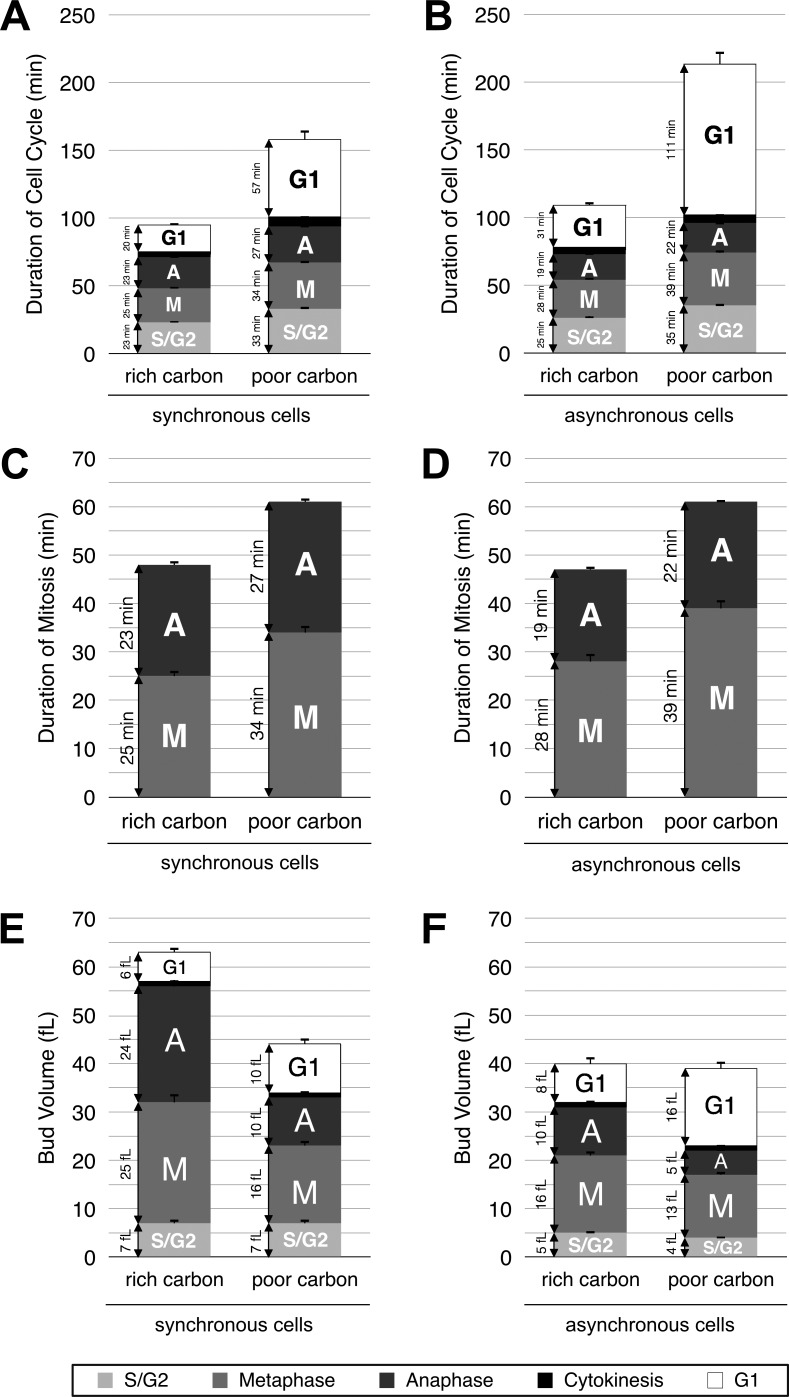
Figure 3.
The duration of mitosis and cell size at completion of mitosis are modulated by nutrients. (A and B) Plots showing the mean durations of all cell cycle stages for synchronous cells (A) or asynchronous cells (B) growing in rich or poor carbon. (C and D) Plots showing the mean durations of metaphase and anaphase for synchronous cells (C) or asynchronous cells (D) growing in rich or poor carbon. (E and F) Plots showing the mean growth in volume during all phases of the cell cycle for synchronous cells (E) or asynchronous cells (F) growing in rich or poor carbon. Error bars represent SEM.

