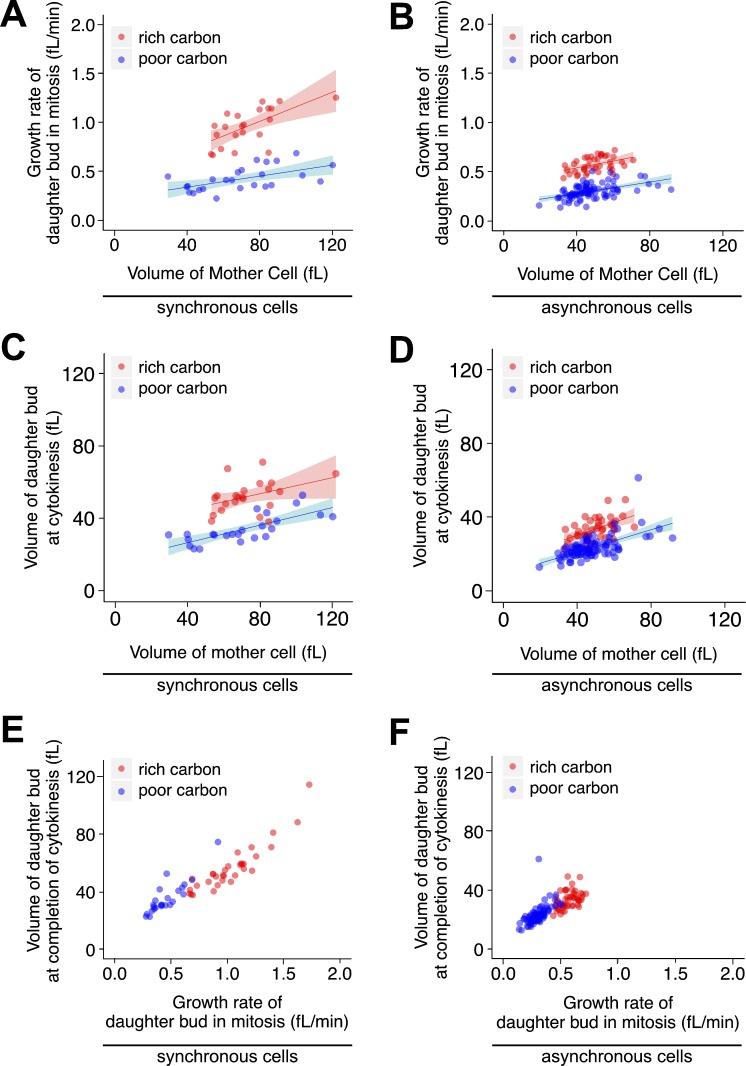
Figure 5.
Cell size at completion of cytokinesis is proportional to growth rate during mitosis. (A and B) The growth rate in mitosis of each daughter bud was plotted against the volume of its mother cell for synchronous cells (A) and asynchronous cells (B). (C and D) The volume of each daughter bud at cytokinesis was plotted against the size of its mother for synchronous cells (C) and asynchronous cells (D). (E and F) The volume of daughter cells at cytokinesis was plotted against their growth rate during mitosis for synchronous cells (E) and asynchronous cells (F). Red dots, cells in rich carbon; blue dots, cells in poor carbon. Smooth lines are logistic regressions of the data. Shaded areas represent 95% confidence interval.

