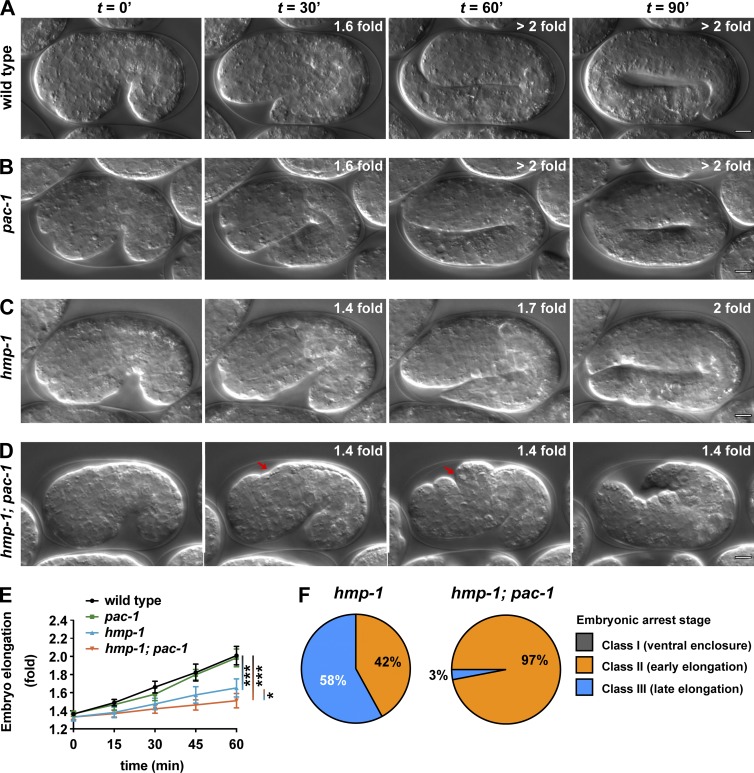
Figure 4.
pac-1enhances hmp-1(fe4) during elongation. (A–D) Stills from DIC time-lapse movies of wild-type, pac-1, and hmp-1 mutant embryos and hmp-1; pac-1 double mutant embryos. Red arrows indicate dorsal epidermal bulges. See Video 6. (E) Quantification of elongation rates for wild-type (n = 12), pac-1 (n = 10), hmp-1 (n = 7), and hmp-1; pac-1 (n = 12) embryos. t = 0 min represents the comma stage, and values are the mean ± SD. (F) Phenotypic classes of hmp-1 (n = 31) and hmp-1; pac-1 (n = 32) mutant embryos. Data were pooled from three independent imaging experiments for each genotype. P-values were calculated using a Mann-Whitney U test. *, P ≤ 0.05; ***, P ≤ 0.001. Bars, 5 µm.

