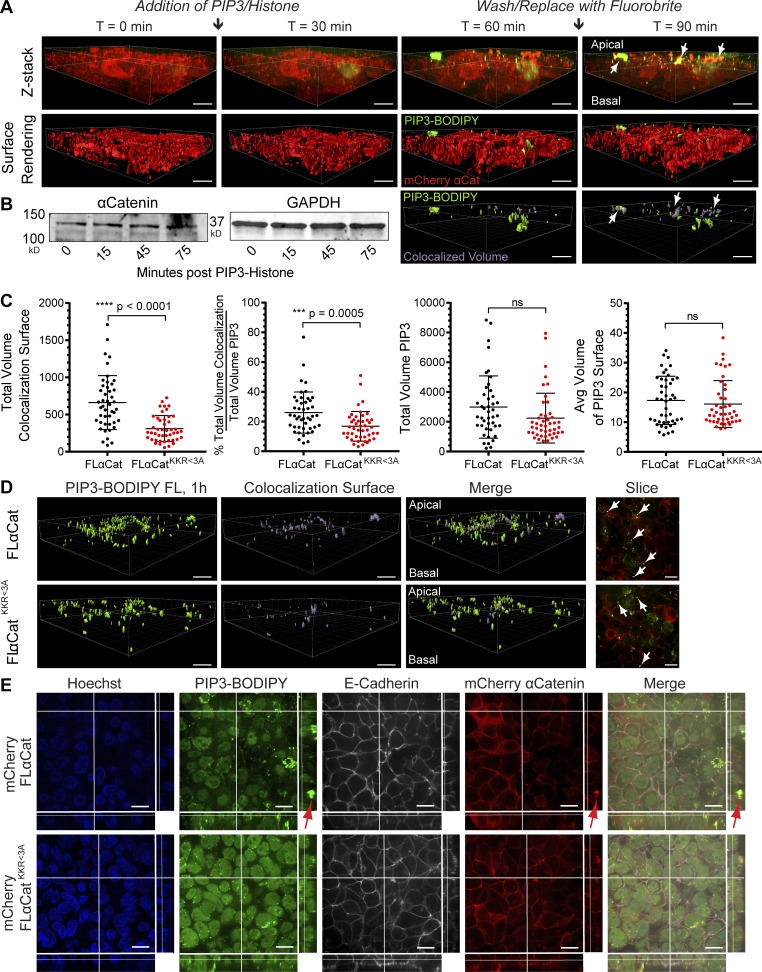
Figure 6.
αCatKKR<3A mutant shows reduced recruitment to exogenous PIP3. (A) PIP3 apical membrane integration and recruitment assay; mCherry αCat (red); BODIPY–PIP3 (green) with quantification of total colocalized surface. Arrows show colocalized surfaces as yellow (top) and purple (bottom) when reconstructed as a volume rendering. (B) BODIPY–PIP3 did not alter expression of αCat (quantification not shown; n = 3). (C) Quantification of colocalization volumes between αCat constructs and PIP3 (n = 45 from three BRs). Significance by unpaired t test: ***, P < 0.0005; ****, P < 0.0001. Error bars reflect the SD of the mean. (D) Surface renderings of colocalization volumes (purple) relative to BODIPY–PIP3 integration (green). Slice shows en face view of Z-stack; arrows show colocalization (0.2-µm steps). (E) E-cadherin was not recruited to ectopic BODIPY–PIP3 integrations, suggesting that this is a unique feature of extrajunctional αCat. Samples were fixed after live-cell imaging, so integration of BODIPY–PIP3 was prolonged relative to Z-stacks in A and D. Bars, 20 µm.

