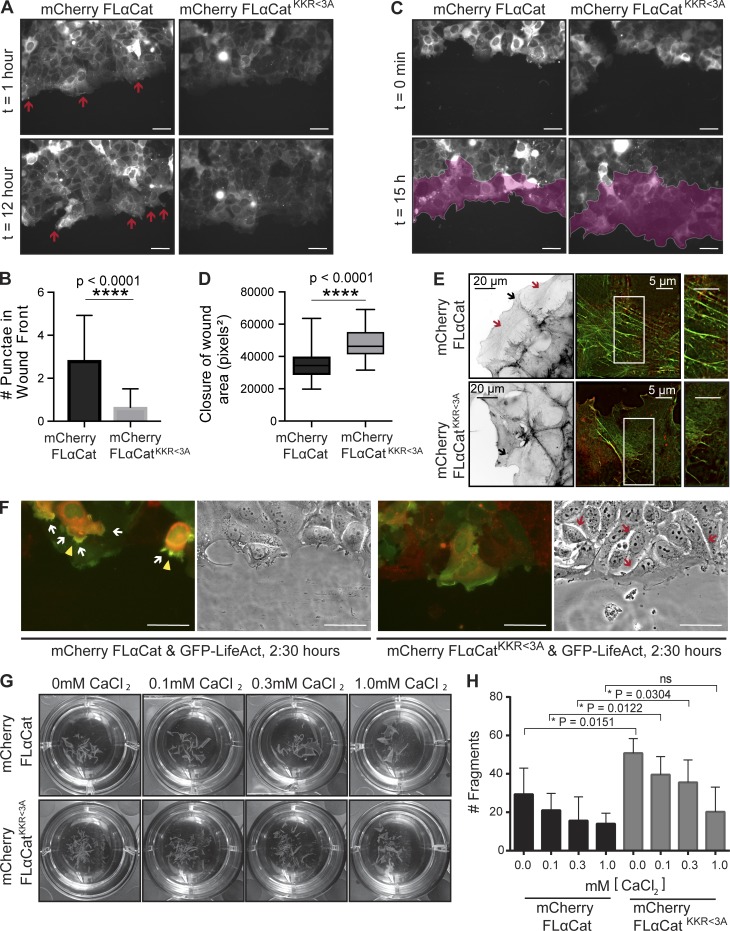
Figure 7.
αCatKKR<3A mutant alters cell–cell adhesion and sheet migration. (A) Live imaging of αCat-expressing R2/7 cells imaged for 12 h postwounding. Arrows indicate αCat recruitment in FLαCat but not FLαCatKKR<3A. (B) Quantification of enrichments (n > 150 FOVs inclusive of all time points, two BRs). Data are mean ± SD. (C) Representative image of wound closure area. Pink overlay depicts area quantified. (D) Quantification of wound closure (n = 24 FOVs, two BRs, data are mean ± SD). See corresponding Video 4. (E) Phalloidin stain of F-actin at wound front. Red arrows indicate actin cables parallel to the front; black arrows indicate actin cables adjoining cells via junctions. High-resolution analysis of F-actin across adjacent cells by SIM (right). (F) Live imaging of GFP-LifeAct and mCherry FLαCat during wound migration. (Left) Fluorescent image; white arrows indicate protrusions with long filopodia; yellow arrowheads show areas of colocalization. (Right) Bright-field image. Bars, 50 µm. (G) Representative images from a mechanical disruption assay with quantification in H (Materials and methods; n = 5 BRs). Data are mean ± SD; significance in all panels by unpaired t test: ****, P < 0.0001.

