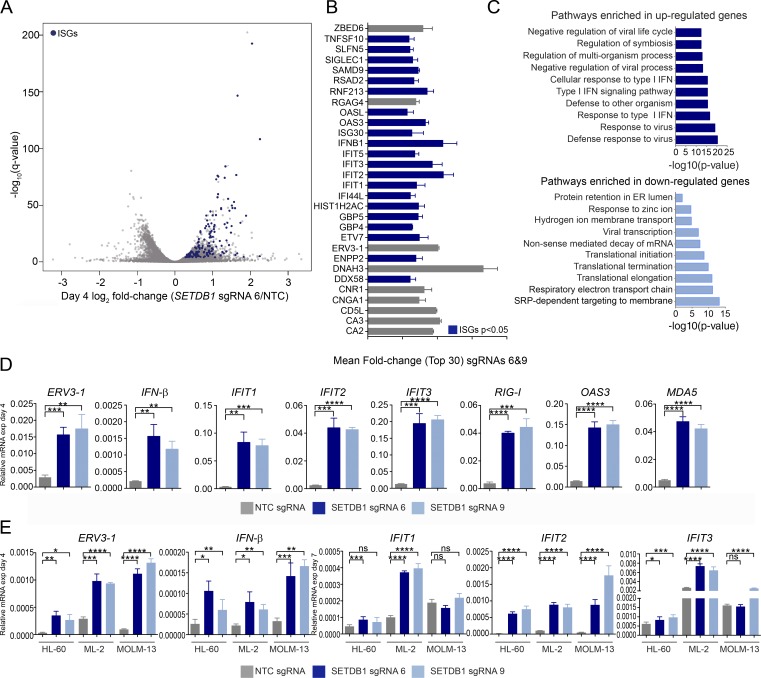
Figure 2.
Loss of SETDB1 leads to the induction of viral response genes. (A) Volcano plot of RNA-seq gene expression changes in THP-1–Cas9 cells after 4 d of treatment with representative SETDB1-specific sgRNA relative to NTC (DESeq2 log2 fold changes vs. significance −log10 [q-value], and n = 3 biological replicates). ISGs are highlighted in blue. (B) Bar plot of top 30 induced genes (ISGs are in blue) in THP-1–Cas9 cells after treatment with two SETDB1-specific sgRNAs (6 and 9) at day 4. Mean fold change was calculated using the fold changes for each SETDB1-specific sgRNA relative to NTC, and n = 3 biological replicates. (C) Panther gene ontology analysis shows most significantly enriched biological processes after SETDB1 disruption at day 4 (genes up-regulated/down-regulated ≥1.5-fold in both cells treated with SETDB1 sgRNAs 6 and 9 were used for the analysis). (D) Taqman qRT-PCR validation of RNA-seq data on day 4, showing relative expression of IFN-inducible transcripts after treatment with SETDB1 sgRNAs or an NTC control sgRNA. n = 3 experiments, and Student’s t tests were performed. (E) Taqman qRT-PCR data on day 4 showing relative expression of IFN-β and ERV3-1 as well as ISGs at day 7 after treatment of three different SETDB1 disruption-sensitive AML lines with SETDB1-specific or NTC sgRNAs. n = 3 experiment, and Student’s t tests were performed. Error bars represent standard deviation. (D and E) ns, not significant, P > 0.05; *, P < 0.05; **, P < 0.01; ***, P < 0.001; ****, P ≤ 0.0001.

