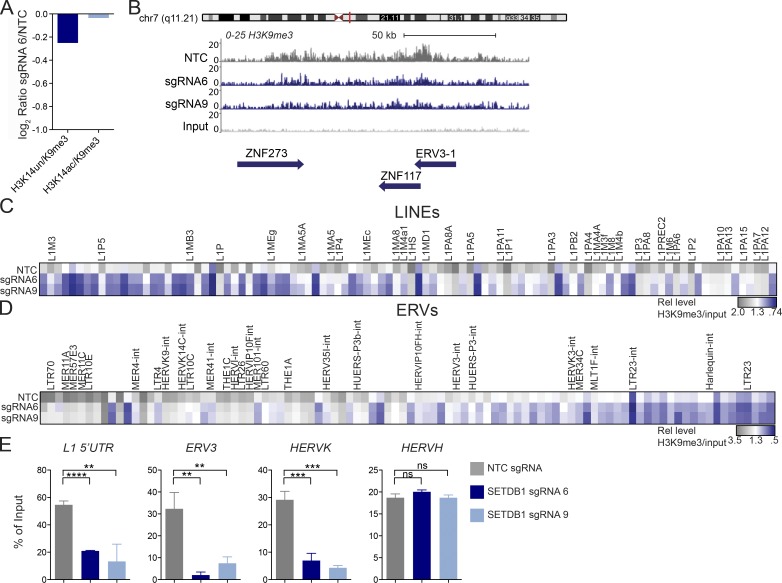
Figure 3.
Loss of SETDB1 leads to a modest reduction in H3K9me3. (A) Histone mass spectrometry analysis of H3K9me3 levels in THP-1–Cas9 cells after 6 d of treatment with SETDB1 sgRNA 6 or NTC (log2 ratios of sgRNA 6 over NTC are shown). (B) Density plot showing H3K9me3 levels over the ERV3-1/ZNF117 locus as well as the neighboring ZNF273 gene (levels of H3K9me3 in THP-1–Cas9 cells are shown after 6 d of treatment with control NTC sgRNA or distinct SETDB1-specific sgRNAs. Y axis is 0–25 and region shown is ∼150 kb. (C) Low input nChIP-seq heat map showing LINE-1 elements with a ≥1.2-fold reduction in H3K9me3 after 6 d of treatment with sgRNA 6, sgRNA 9, or NTC. For each sgRNA, the relative enrichment = fractional H3K9me3 reads/nonimmunoprecipitated chromatin reads (input/background). Highlighted genes were up-regulated at days 4, 7, or both days in SETDB1 mutant RNA-seq datasets. (D) As in C; heat map showing ERV elements with a ≥1.2-fold reduction in H3K9me3 after 6 d of treatment with sgRNA 6, sgRNA, 9 or NTC. (E) ChIP-PCR validation of ChIP-seq data from day 6, showing percentage of input of cells treated with NTC or SETDB1-specific sgRNAs for L1 LINE 5′UTR, HERV-K-rev, ERV3-1-exon, and HERV-H-pregag (n = 3 experiments. Student’s t tests were performed). All error bars represent standard deviation. ns, not significant, P > 0.05; **, P < 0.01; ***, P < 0.001; ****, P < 0.0001.

