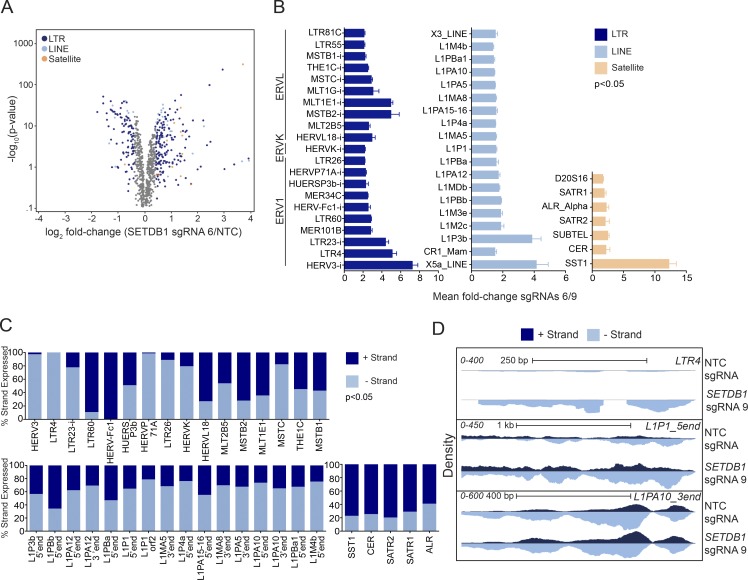
Figure 4.
Loss of SETDB1 leads to the induction of TEs. (A) An RNA-seq volcano plot depicting expression changes of TEs in THP-1–Cas9 cells at day 7 after treatment with a representative SETDB1-specific sgRNA versus NTC (n = 3 for all samples, EdgeR GLM log2 fold change). (B) Bar plots showing statistically significant (P < 0.05) EdgeR GLM fold changes of TEs in SETDB1 sgRNA–treated THP-1–Cas9 cells (mean fold change of sgRNAs 6 and 9) over NTC at day 7 (n = 3 biological replicates, and error bars represent standard deviation). (C) Bar plots derived from strand-specific RNA-seq of SETDB1 or NTC sgRNA–treated THP-1–Cas9 cells at day 7. Up-regulated TEs are shown as a percentage of reads derived from 5′ or 3′ transcribed products. In B and C, "i" denotes "internal." (D) Density plots showing an example of a unidirectionally transcribed TE (LTR4), a bidirectionally transcribed element (L1P1_5′end), and a second bidirectionally transcribed element in which only one strand is increased after treatment with an SETDB1-specific sgRNA for 7 d (L1PA10_3′end).

