Figure 6.
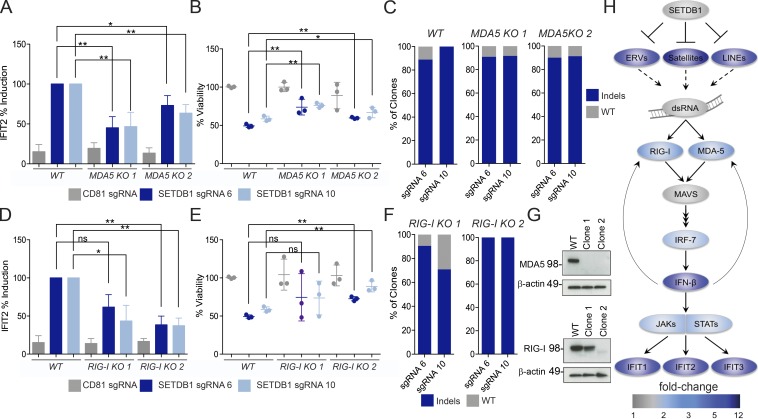
IFN response and cell death in SETDB1 mutant cells are dependent on the viral sensing machinery. (A) Induction of IFIT2 expression after SETDB1 disruption or control gene (CD81) disruption, in THP-1–Cas9 cells (WT) or two MDA5 KO THP-1–Cas9 clones. Total RNA was analyzed 5 d after nucleofection of cells with synthetic SETDB1 gRNAs or control gRNA targeting CD81. (B) Cell viability at day 5 after nucleofection for cells and conditions described in A. (C) Indel rate at noted target sites for THP-1–Cas9 cells for cells and conditions described in A. Genomic DNA analyzed at day 5 after nucleofection. (D) Induction of IFIT2 expression after targeting SETDB1 or control gene (CD81) disruption in THP-1–Cas9 cells (WT) or RIG-I hypomorphic (clone 1) and KO (clone 2) THP-1–Cas9 clones. Total RNA was analyzed 5 d after nucleofection of cells with synthetic SETDB1 gRNAs or control gRNA targeting CD81. (E) Cell viability at day 5 after nucleofection for cells and conditions described in D. (A, B, D, and E) n = 3 experiments, and Student’s t tests were performed. (F) Indel rate at noted target sites for THP-1–Cas9 cells for cells and conditions described in D. Genomic DNA analyzed at day 5 after nucleofection. (G) Western blot analysis of MDA5, RIG-I, and β-actin in THP-1–Cas9 WT or clonal lines after overnight stimulation with IFN-β. (H) Model of SETDB1 function, based on ingenuity analysis 4 RNA-seq data 4 d after SETDB1 disruption (as shown in Fig. 2), as well as incorporating TEs into map. Color bar denotes fold change compared with NTC-treated cells. All error bars represent standard deviation. (A, B, D, and E) ns, not significant, P > 0.05; *, P < 0.05; **, P < 0.01.

