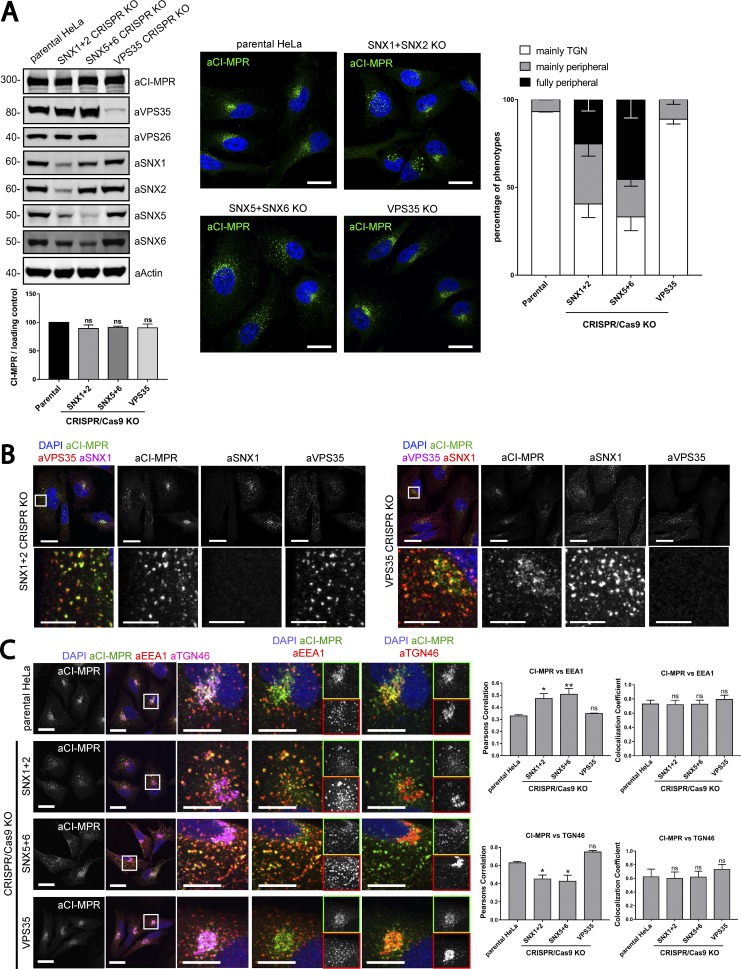
Figure 7.
Gene editing confirms the essential role of SNX1/2–SNX5/6 in endosome-to-TGN recycling of CI-MPR. (A, left) CI-MPR levels and CI-MPR steady-state localization in retromer and SNX1/2–SNX5/6 KO cells. HeLa cells were transfected with CRISPR-Cas9 plasmids against SNX1 and SNX2, SNX5 and SNX6, or VPS35. 96 h after transfection, endogenous protein levels were analyzed by Western blotting, and cells were fixed and stained for endogenous CI-MPR. n = 3 independent experiments (one-way ANOVA compared with parental HeLa). Molecular masses are given in kilodaltons. (A, middle) Representative images. Bars, 20 µm. (A, right) quantification of the percentage of cells displaying each phenotype. n = 3 blindly scored independent experiments; parental, 116 cells; VPS35, 106 cells; SNX5 + SNX6, 111 cells; VPS35, 106 cells. (B) Immunofluorescence of endogenous CI-MPR and endogenous SNX1 and VPS35 in retromer KO cells and SNX1 and SNX2 KO cells. Bars: (top) 20 µm; (bottom) 5 µm. (C) Immunofluorescence and colocalization analysis of endogenous CI-MPR and TGN marker TGN46 and early endosomal marker EEA1 in SNX1 and SNX2, SNX5 and SNX6, and VPS35 CRISPR-Cas9 KO HeLa cells. Bars: (main images) 20 µm; (insets) 10 µm. (C, top right) n = 3 independent experiments; parental HeLa, 80 cells; SNX1+2 KO, 99 cells; SNX5+6, 81 cells; VPS35 KO, 76 cells. (C, bottom right) n = 4 independent experiments; parental HeLa, 102 cells, SNX1+2 KO, 114 cells; SNX5+6, 104 cells; VPS35 KO, 102 cells (means ± SEM; one-way ANOVA compared with parental HeLa; *, P < 0.05; **, P < 0.01).

