Figure 3.
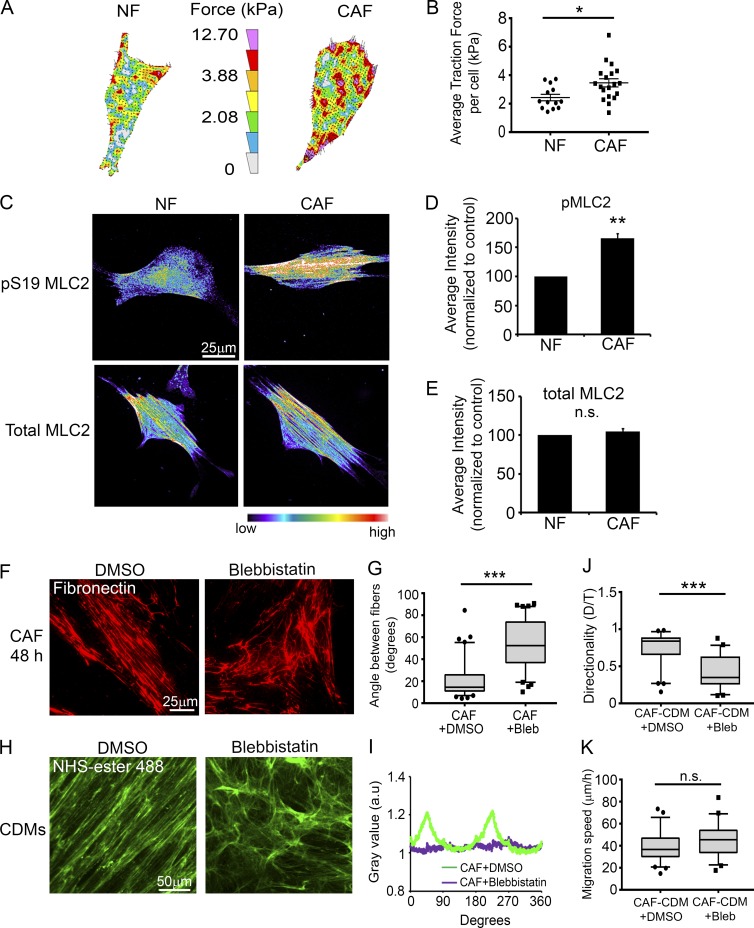
Myosin-II-driven traction force and contractility mediate parallel Fn organization by CAFs. (A) Representative traction force vector maps of a NF and a CAF. Warmer colors indicate areas with high traction forces. (B) Dot plot shows mean traction forces in NFs and CAFs. Line indicates the mean; error bars indicate SEM. A total of 13 NFs and 19 CAFs were analyzed in three independent experiments. *, P < 0.02, determined by Student’s t test. (C) Immunostaining for pS19-MLC2 or total MLC2 in NFs and CAFs. Images are shown in pseudocolor; warmer colors indicating high intensity, whereas cooler colors indicating low intensity. (D and E) Quantification of mean fluorescent intensity of pS19-MLC2 (D) and total MLC2 (E) in NFs and CAFs, normalized to NFs. Error bars indicate SEM from three individual experiments. More than 77 cells were analyzed per condition. **, P < 0.01; n.s., not significant, as determined by Student’s t test. (F) Fn staining of CAFs after 48 h treatment with DMSO (left) or 20 μM blebbistatin (Bleb; right). Bar, 25 µm. (G) Measurements of angles between Fn fibers in CAFs treated with DMSO or blebbistatin. More than 80 angles measured per condition from at least 12 images from three independent experiments. ***, P < 0.001, analyzed by Mann-Whitney U test. (H) NHS–ester-488 staining of CAF CDMs generated during DMSO (left) or blebbistatin (right) treatment. Bar, 50 µm. (I) FFT analysis of CDM images shown in H. (J and K) Box plots showing directionality ratio (J) and migration speed (K) of DU145 cell migration on CAF CDMs generated during DMSO or blebbistatin treatment. ***, P < 0.001; n.s., not significant, analyzed by Mann-Whitney U test. Greater than 50 cells per condition from three independent experiments were analyzed. The box plots range from the 25th to the 75th percentiles; the central line indicates the median, and the whiskers range from the 5th to the 95th percentiles.

