Figure 6.
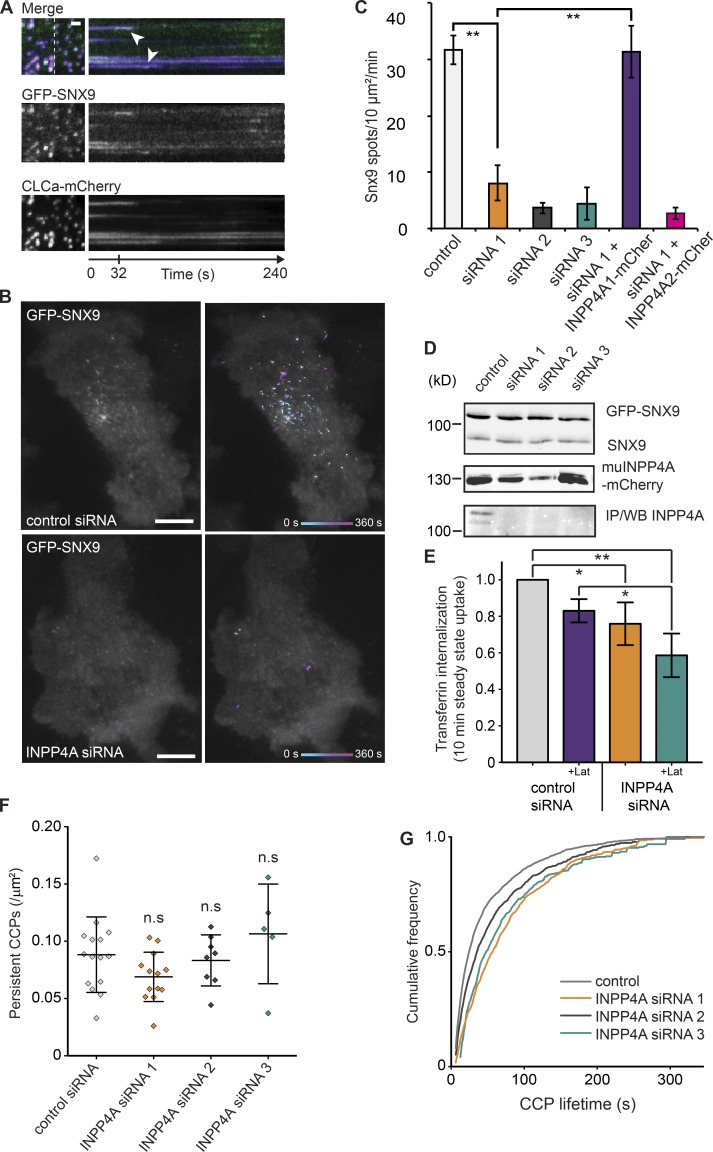
PI(4,5)P2/PI(3)P stimulated actin polymerization functions during CME. (A) TIRFM imaging (4 min) of a cell stably expressing GFP-SNX9 and transiently transfected with clathrin-Lca-mCherry. A region of interest indicated by the white dashed line is presented as a kymograph. SNX9 frequently peaks at the end of the clathrin track, indicated by white arrowheads. Bar, 1 µm. (B) HeLa cells stably expressing GFP-SNX9 are presented from single frames of TIRFM videos. Recordings of the accumulated GFP-SNX9 spots during a 4-min TIFRM time lapse are overlaid in the representative micrographs on the right. Bars, 10 µm. siRNA-mediated INPP4A knockdown decreases the number of SNX9 spots forming at the cell surface. (C) Quantification of SNX9 spot dynamics from three to eight cells per sample from three independent experiments. Student's t test between control and siRNA1: **, P = 0.0043. Between siRNA1 and siRNA1 + muINPP4A1-mCherry: **, P = 0.004. (D) Western blots (WB) showing that levels of GFP-SNX9 and endogenous SNX9 remain the same in INPP4A knockdown cells. Levels of INPP4A are reduced with all three siRNAs against INPP4A. INPP4A was concentrated by immunoprecipitation (IP) and then detected by Western blotting. Expression of murine INPP4A and variant1-mCherry is resistant to INPP4A siRNA1 and 3. (E) Transferrin uptake was reduced on INPP4A reduction and latrunculin A treatment. Transferrin internalization was measured without fetal bovine serum starvation (steady state) to avoid perturbation of CME. Quantification was from three independent experiments; ordinary one-way ANOVA gives P = 0.0033; Tukey's HSD test control to INPP4A siRNA: *, P = 0.0431; control to INPP4A siRNA + Lat: **, P = 0.0021; and control + Lat compared with INPP4A + Lat: *, P = 0.0408. (F) Persistent CCPs (of long duration and large size) are unaffected by INPP4A siRNA. n = 15 control, 13 INPP4A siRNA1-, 8 siRNA2-, and 5 siRNA3-treated cells. ns, not significant. (G) Lifetime of remaining CCPs was increased with INPP4A knockdown. Numbers of CCPs analyzed were control, 4,122; INPP4A siRNA1, 1,340; INPP4A siRNA2, 1,573; and INPP4A siRNA3, 629. Kolmogorov–Smirnov test control versus INPP4A siRNA1 is P < 0.0001, control versus INPP4A siRNA2 is P = 0.0268, and control versus INPP4A siRNA3 is P < 0.0001. Error bars show SEM.

