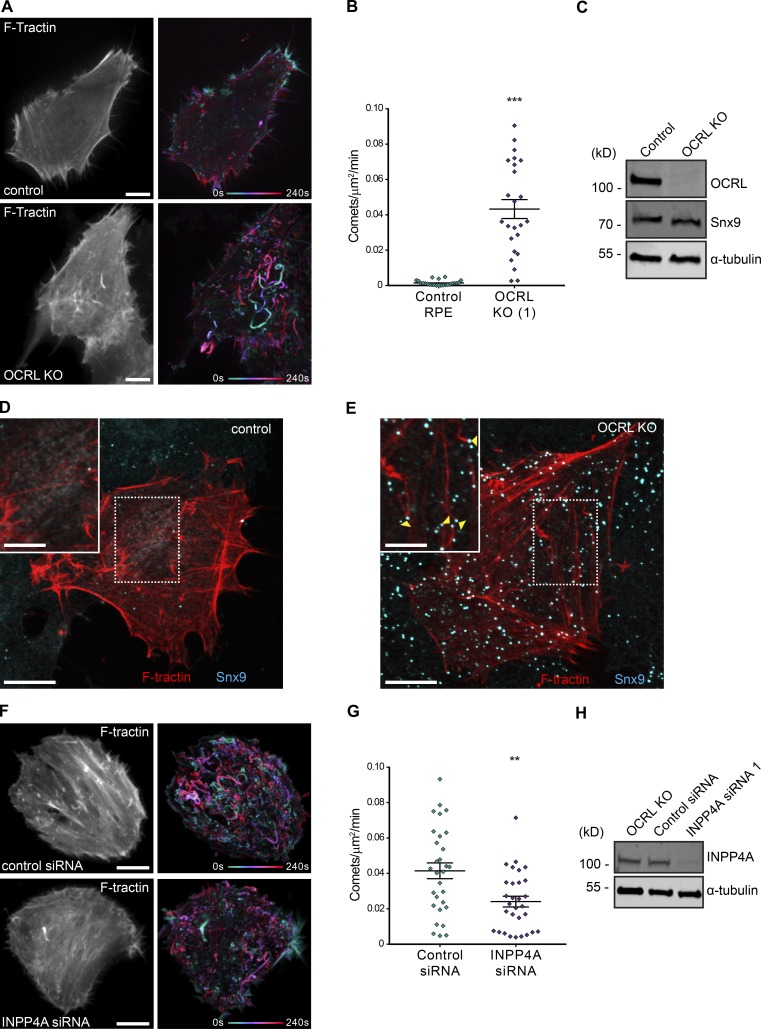
Figure 7.
Actin comets in OCRL-deficient RPE cells and their reduction on INPP4A siRNA. (A) Live imaging over a 4-min period of F-tractin expressing control RPE and OCRL KO cells as shown in Video 3, showing motile actin comets in the KO not observed in control cells. The single channel image indicates a single time point, and the colored image shows a projection of the entire time course, temporally colored as indicated. (B) Quantification of actin comets from n = 24 cell regions for each condition. Each data point is plotted individually, along with the mean ± SEM for each condition. Difference assessed by Student’s t test. ***, P < 0.0001. (C) Western blot confirming OCRL KO in the OCRL KO CRISPR/Cas9 edited clone. Levels of SNX9 remain unchanged. α-Tubulin acts as a loading control. (D and E) Control and OCRL KO cells expressing GFP–F-tractin and immunolabeled for SNX9 with enlarged regions as insets. SNX9 puncta are always located at the head of actin comets (arrowheads in E). (F) Live imaging over a 4-min period of F-tractin OCRL KO cells treated with nontargeting control siRNA or INPP4A siRNA1, as shown in Video 5, showing reduction in comets on INPP4A knockdown. Bars: (main images) 10 µm; (insets) 5 µm. (G) Quantification of actin comets from n = 30 cell regions for each treatment. Bars indicate the mean ± SEM for each condition. Difference assessed by Student’s t test. **, P = 0.002. (H) Western blot verifies INPP4A knockdown in the OCRL KO clone.

