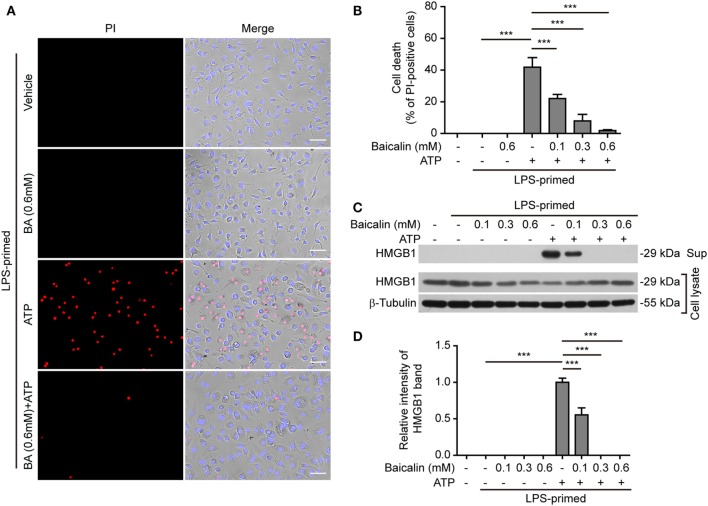
Figure 3.
Baicalin inhibited adenosine triphosphate (ATP)-induced cell death in macrophages. Bone marrow-derived macrophages were treatment as in Figure 1A. (A) Cell death was measured by staining with propidium iodide (PI) (red, staining dead cells) and Hoechst 33342 (blue, staining all cells) together for 10 min. All images were captured by fluorescence microscopy and showed in merge with bright-field images. One set of representative images of three independent experiments is shown. Scale bars, 50 µm. (B) PI-positive cells in five randomly chosen fields with each containing ~100 cells were quantified. The percentage of cell death is defined as the ratio of PI-positive cells relative to all cells (revealed by Hoechst). Data are shown as mean ± SD (n = 5). (C) Cells were treated as in panel (A). Western blotting was used to assess the expression levels of indicated proteins in the cell lysates and culture supernatants, respectively. β-Tubulin was adopted as a loading control for cell lysates. (D) Histograms showing the relative intensity of high-mobility group box-1 (HMGB1) band in culture supernatants in panel (C). The intensity of HMGB1 band in ATP group was set to 1.0 while those of the other groups were calculated relative to the ATP group. The experiments were performed three times independently, with one representative experiment shown. Data are shown as mean ± SD (n = 3). ***P < 0.001; BA, baicalin; Sup, supernatant.

