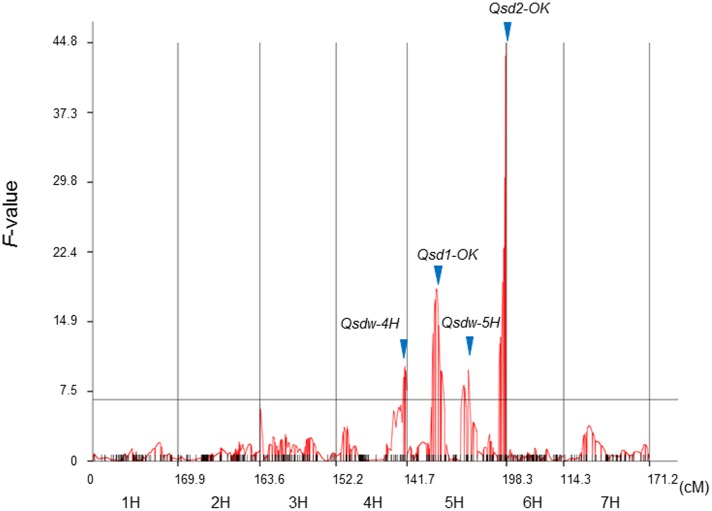
FIGURE 2.
Quantitative trait loci (QTL)-likelihood curves generated by QTLNetwork. Germination data of the RILs with three replications in 3 years, 2010, 2011, and 2013, were used for data processing. Blue arrows indicate the detected QTL locations. The horizontal black line indicates the QTL threshold equivalent to a critical F-value of 6.58 (p < 0.05). cM: centiMorgan.

