
Figure 3.
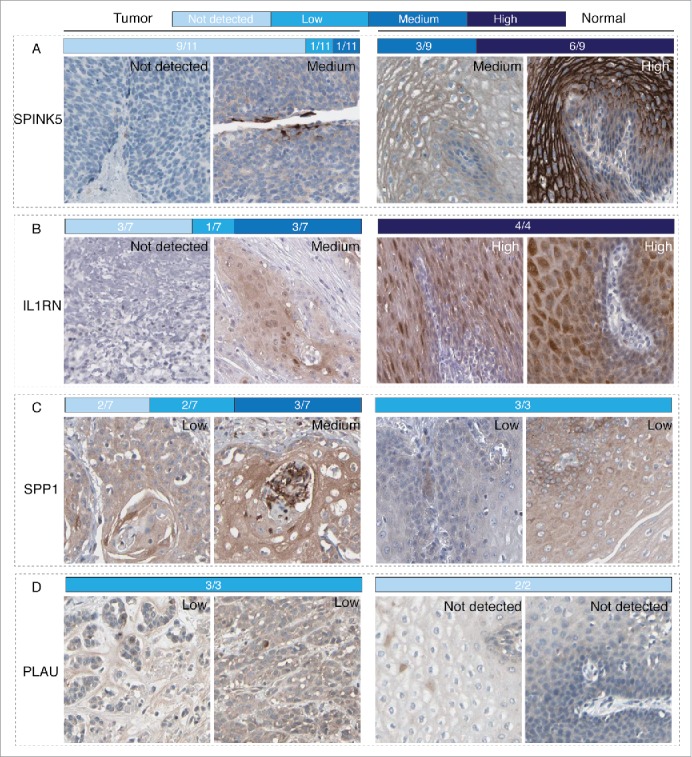
IHC validations of the top2 downregulated and upregulated genes in ESCC. Representative images for expression of each genes in ESCC tissues and normal esophageal tissues were shown with the fraction of samples with antibody staining/protein expression level high, medium, low, or not detected were provided by the blue-scale color-coding. Panel A and B. Expression of SPINK5 and IL1RN, which were top2 downregulated genes in the microarray data, in ESCC tissues were obviously lower than that in normal esophageal tissues. Panel C and D. Expression of SPP1 and PLAU, which were top2 upregulated genes in the microarray data, in ESCC tissues were obviously higher than that in normal esophageal tissues.