
Figure 2.
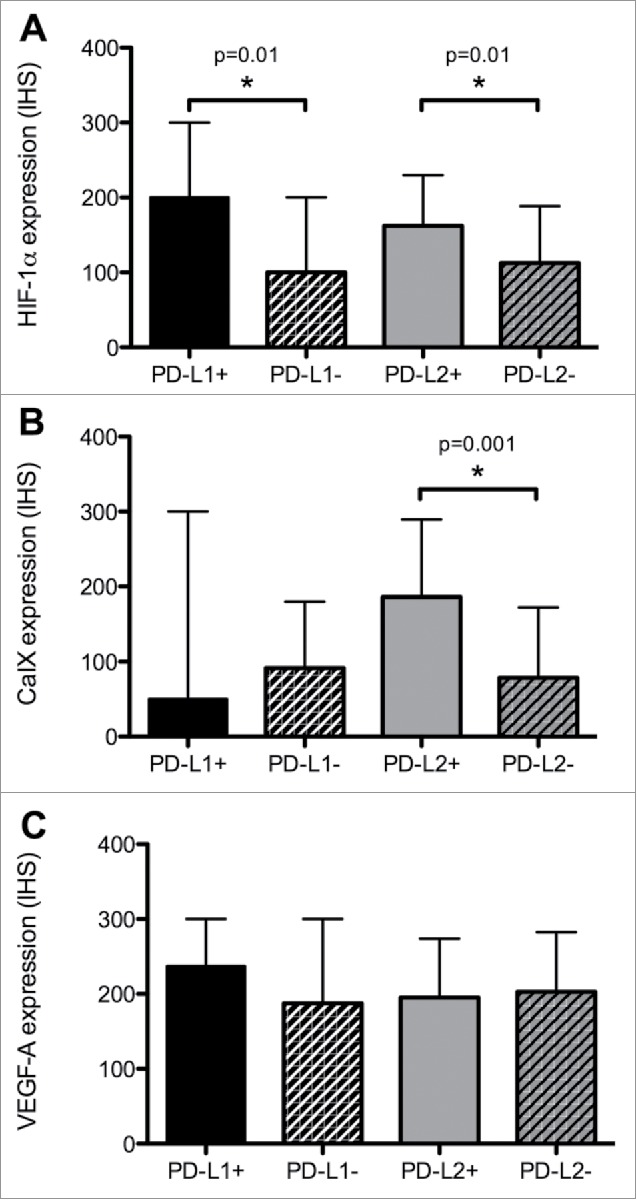
The relationship between PD ligands and the expression of Hif-1α (Panel A), CaIX (Panel B) and VEGF-A (Panel C). Expression of candidate biomarkers is quantified using an immuno-histoscore (IHS). Median values (+/− interquartile ranges) are presented. An asterisk (*) highlights a statistically significant difference in median IHS values resulting from a Mann-Whitney U test.