
Figure 1.
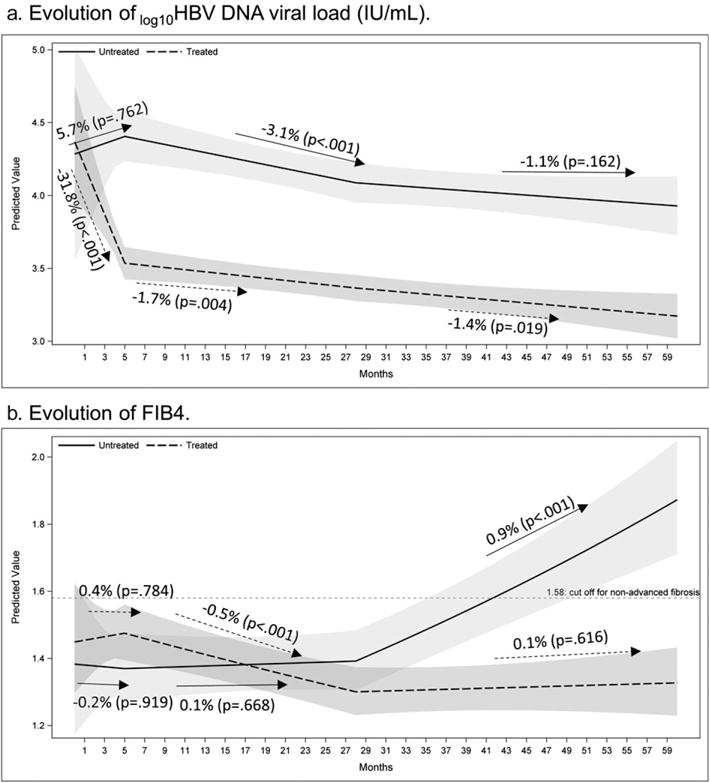
Predicted mean of trajectories of log10 viral load and fibrosis-4 (FIB4) over time by treatment groups. Shaded area: 95% confidence band.
Official websites use .gov
A
.gov website belongs to an official
government organization in the United States.
Secure .gov websites use HTTPS
A lock (
) or https:// means you've safely
connected to the .gov website. Share sensitive
information only on official, secure websites.
Predicted mean of trajectories of log10 viral load and fibrosis-4 (FIB4) over time by treatment groups. Shaded area: 95% confidence band.