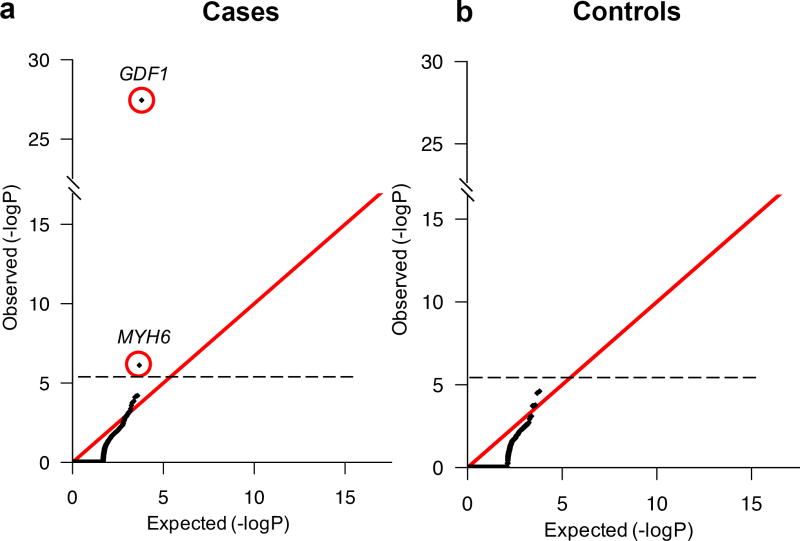
Figure 1. Quantile-quantile plots comparing observed versus expected P-values for recessive genotypes in each gene in cases and controls.
Recessive genotypes (RGs) shown include LoF, D-Mis, and non frameshift insertion/deletions. The expected number of RGs in each gene was calculated from the total number of observed RGs as described in Methods. The significance of the difference between the observed and expected number of RGs was calculated using a one-sided binomial test. (a). Quantile-quantile (Q-Q) plot in cases. (b). Q-Q plot in controls. While the observed values closely conform to expected values in controls, two genes, GDF1 and MYH6, show a significantly increased burden of RGs in cases and survive the multiple-testing correction threshold.

