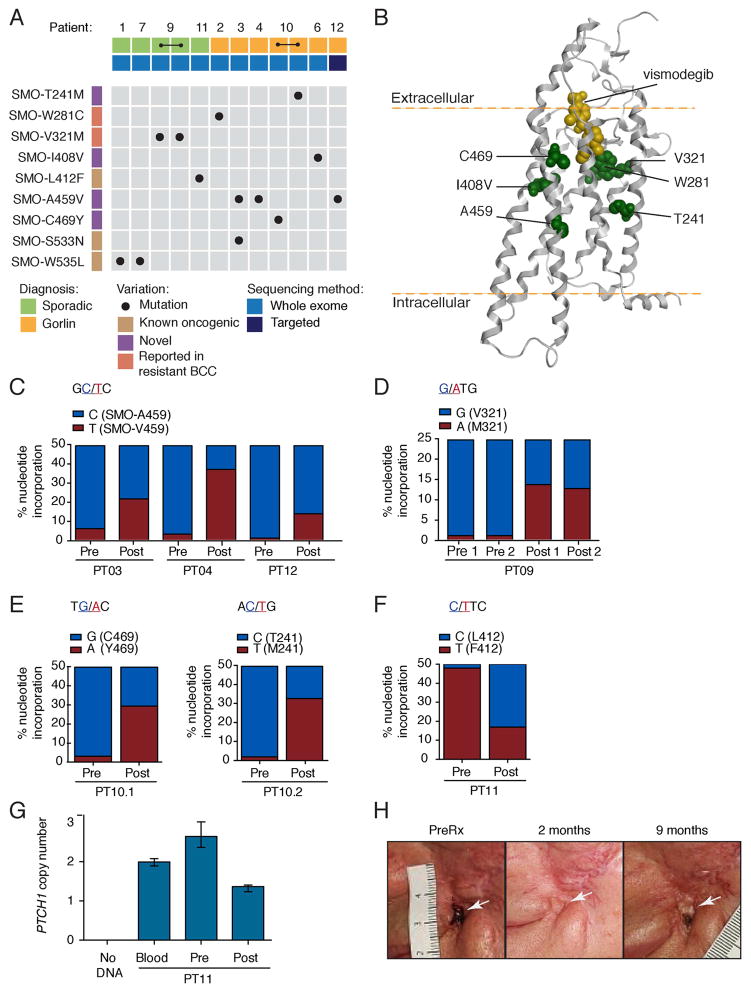
Figure 2. SMO mutations in vismodegib-resistant BCC.
(A) Overview of SMO mutations identified in this study. All mutations were somatic in nature, as they were not detected in either blood or other tissue from the same patient.
(B) Computational model of vismodegib (yellow) docked onto the crystal structure of the SMO TM region (grey helices; Wang et al., 2013). Previously uncharacterized mutant residues are highlighted in green.
(C–F) Prevalence of SMO mutations in pre- and post-treatment biopsies. Bar graphs show the incorporation frequency of either wild-type (blue) or mutant (red) nucleotides at positions corresponding to SMO-A459V for PT03, PT04 and PT12 (C), SMO-V321M for PT09 (D), SMO-C469Y and SMO-T241M for PT10 (E) and SMO-L412F for PT11 (F) as determined by pyrosequencing. Note that SMO mutations are expected to be heterozygous and that SMO copy number determines the maximum Y-axis value, which is 50% for PT03, PT04, PT12, PT10 and PT11 (SMO copy number is 2) and 25% for PT09 (SMO copy number is 4). Incorporation of mutant nucleotides was considered to be within the background levels (<5%) of the pyrosequencing assay in all pre-treatment samples.
(G) PTCH1 copy number in pre- and post-treatment biopsies from PT11. Data plotted are mean and the range of quadruplicates.
(H) Photographs of a locally advanced BCC (white arrow) from PT11 that initially responded to vismodegib, but subsequently relapsed after the indicated length of time.

