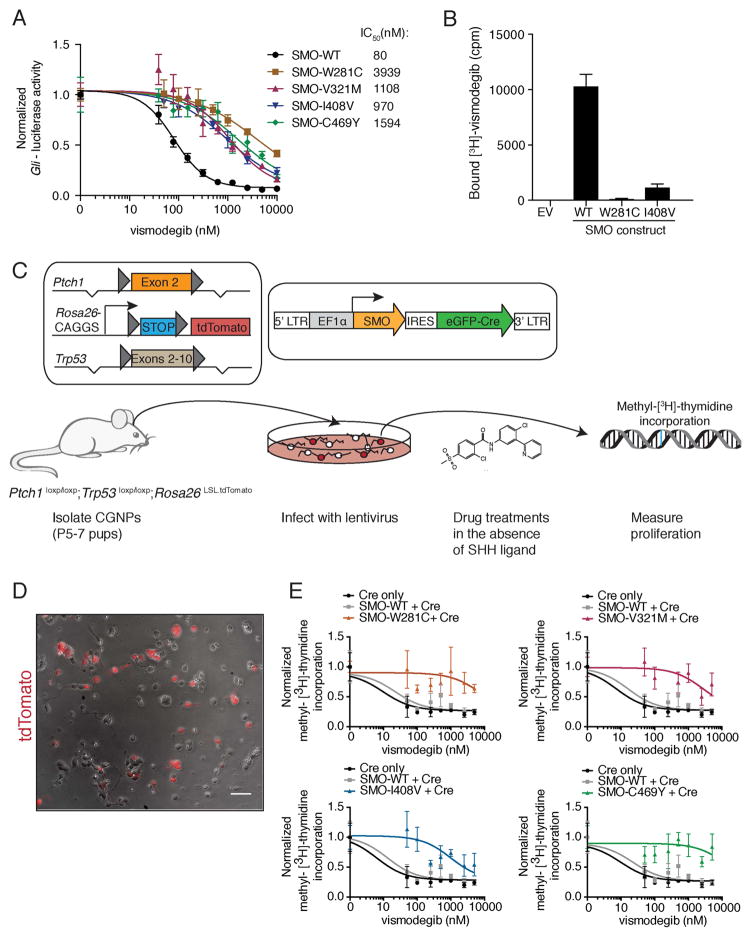
Figure 4. Functional analyses of SMO drug-binding pocket mutants.
(A) Normalized Gli-luciferase reporter activity in C3H10T½ cells transfected with constructs expressing indicated SMO variants, following a dose response with vismodegib. Values were normalized to untreated activity and data plotted are mean +/− standard deviation (SD) of triplicates. IC50 values were calculated after non-linear regression fitting.
(B) Binding of [3H]-vismodegib to HEK-293 cells transfected with constructs expressing indicated SMO variants. EV stands for empty vector and drug binding was measured in counts per minute (cpm). Specific binding was calculated after competition with an excess of unlabeled vismodegib by subtracting non-specific binding from total binding. Data shown are the mean +/− SD.
(C) Viral transduction scheme of primary CGNPs. Only transduced CGNPs proliferate in the absence of SHH, allowing us to specifically test the ability of our SMO variants to promote proliferation in the presence of vismodegib.
(D) Overlay of a representative bright field and red fluorescent image from a PPT CGNP culture after infection with a Cre-expressing lentivirus. The scale bar represents 50 μm.
(E) Normalized methyl-[3H]-thymidine incorporation of PPT CGNPs transduced with indicated viruses, following a dose response with vismodegib after removal of SHH ligand. Each graph shows the same control data. Data plotted are mean +/− SD of triplicates.
See also Figure S3.

