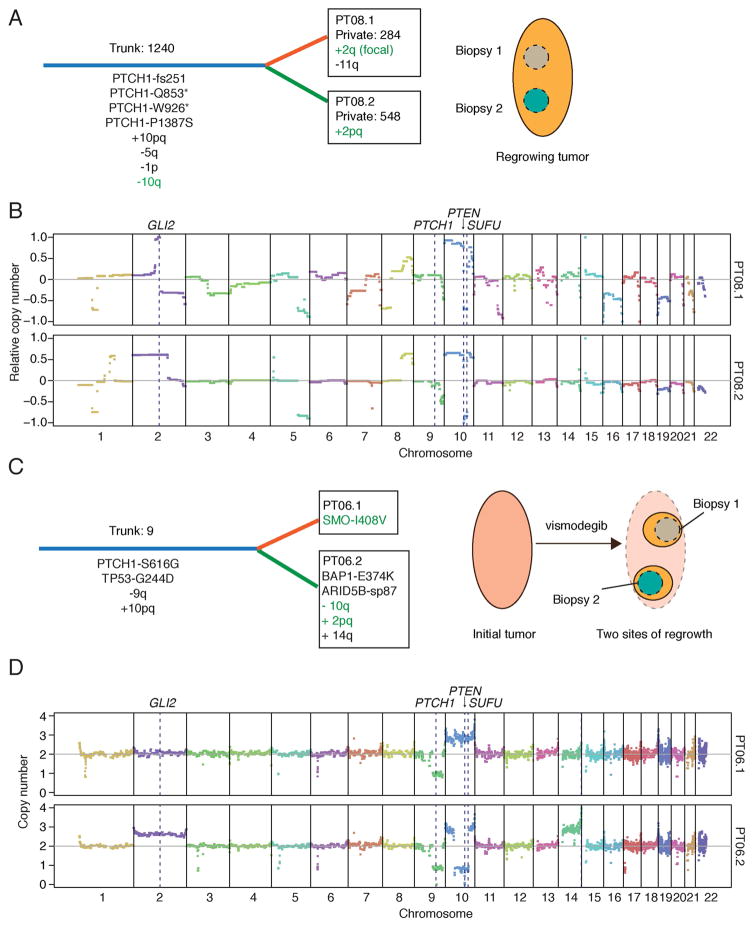
Figure 7. Intra-tumor heterogeneity and downstream resistance mechanisms.
(A) Schematic depicting genetic heterogeneity between two biopsies from PT08. Common (Trunk; blue) and unique (Private; orange or green) genetic events are shown with their respective number of somatic mutations. Putative resistance mechanisms are highlighted in green text. Cartoon on right shows spatially separated biopsy sites from the same progressing lesion.
(B) CNV plots for PT08.1 and PT08.2 highlighting key genes that likely contributed to tumor initiation and vismodegib resistance. Copy numbers were derived from array CGH and are shown relative to control tissue.
(C) Schematic depicting genetic heterogeneity between two biopsies from PT06 (same labeling scheme as in (A)). Mutational analysis of a pre-defined list of cancer-associated genes was used to compare the two sites, as germline calls were not available. Cartoon on right shows two separate sites of regrowth from the same regressed lesion.
(D) CNV plots for PT06.1 and PT06.2 highlighting key genes that likely contributed to tumor initiation and vismodegib resistance. Absolute copy number values were derived from SNP arrays.
See also Figure S5.

