
Figure 1. Cells in the medullary cords sense higher concentrations of extracellular S1P than cells in the T zone.
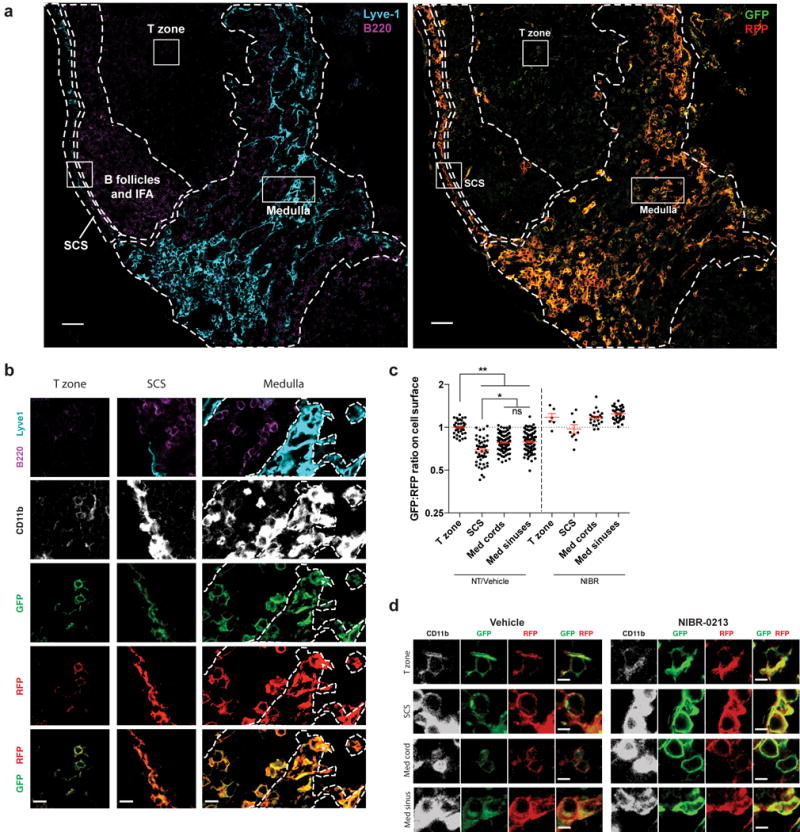
(a) LN section from an S1P reporter mouse (Mx1-Cre) stained with antibodies against CD11b (not shown), Lyve1 (cyan), B220 (purple), GFP (green), and RFP (red). Left: B220 and Lyve1 staining was used to identify the subcapsular sinus (SCS), medulla, T zone, and B follicles/interfollicular areas (IFA). Boundaries between regions are indicated by dashed lines. The medulla was defined as Lyve1-rich regions. Within the medulla, cords were defined as Lyve1-negative areas that contained relatively dense B cells. Medullary sinuses were defined as Lyve1 positive areas with scarce B cells. Medullary cords and sinuses were identified conservatively, and ambiguous areas were excluded. Right: Reporter staining. (high resolution file: https://figshare.com/s/a88afb6d06b90b3af860). Boxed areas are shown in greater detail in Fig. 1b. Bright reporting cells at the T/B boundary are high endothelial venules. Scale bar, 50 μm. Representative of 16 images from 5 mice in 5 experiments.
(b) Insets of cells from the T zone, SCS, and medulla from the reporter LN shown in Fig. 1a. Lymphatic sinuses are indicated by dotted lines in the medulla inset. Scale bars, 10 μm.
(c) Quantification of S1P reporting in the T zone, subcapsular sinus (SCS), medullary cords, and medullary sinuses. Pixels positive for both RFP and CD11b were identified, marking the surface of reporter-expressing myeloid cells. The ratio of GFP to RFP for each CD11b+RFP+ pixel was calculated, and the ratio was averaged over a defined area. Each point on the graph represents the average ratio over an area of at least 1.8×10³ square microns for the SCS; 8×10² square microns for medullary cords or sinuses; and 5.5×10² square microns for the T zone. Horizontal lines indicate the mean and SEM. To account for different microscope settings on different days, for each experiment all ratios were normalized such that the average ratio for the T zone in non-treated (NT) or vehicle-treated animals was 1.0. For non-treated and vehicle-treated animals, graph compiles 16 sections from 5 mice. For NIBR-0213 treated animals (see Fig. 1d legend), graph compiles 4 sections from 2 mice. Data compile 3 experiments analyzing non-treated mice and 2 experiments analyzing NIBR-0213 and vehicle-treated animals. *, p<0.01; **, p<0.0001; (ANOVA with post-hoc Tukey HSD test for multiple comparisons).
(d) Littermate pairs of S1P reporter mice (UBC-CreERT2 or Mx1-Cre) were treated i.p. with 30 mg/kg of the S1PR1 antagonist NIBR-0213 or vehicle once daily for 8 days. LN were harvested 3–5 hours after the last dose. LN sections were stained with antibodies against GFP (green), RFP (red), CD11b (white), and Lyve1 and B220 (to define LN regions, not shown). Representative cells are shown from the T zone, SCS, medullary cords, and medullary sinuses of NIBR-0213 or vehicle-treated S1P reporter mice. Scale bar, 5 μm. Representative of 3 (vehicle-treated) or 4 (NIBR-0213-treated) images from 2 pairs of mice in 2 experiments (image files: https://figshare.com/s/fd985aa726576b6cb9e7 and https://figshare.com/s/bc2ada688bc9ba074cfe).