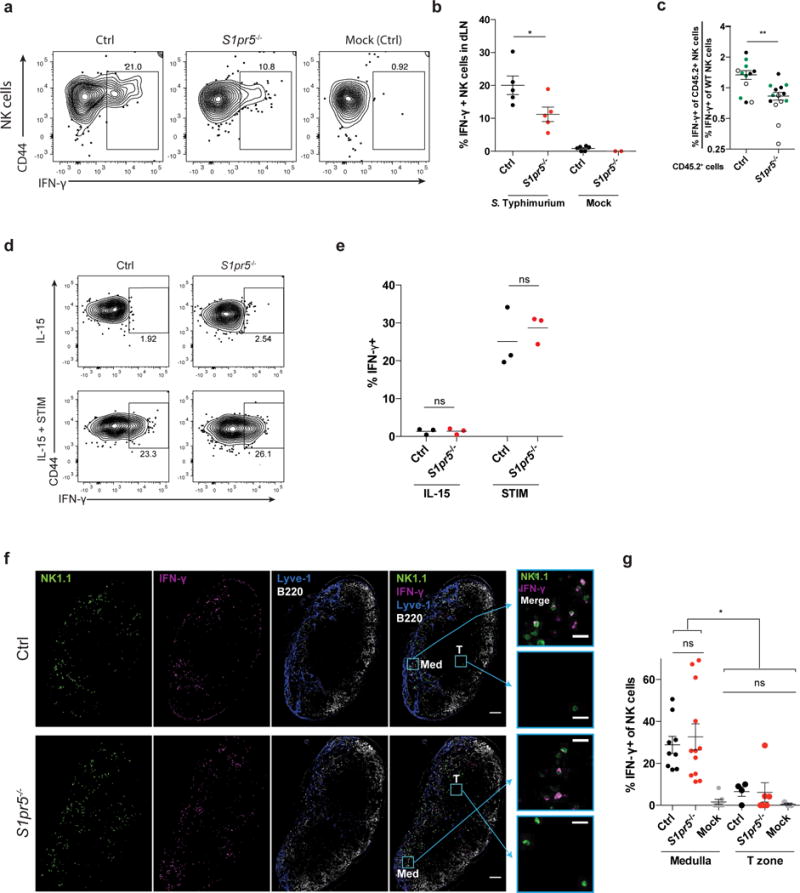
Figure 5. Mislocalization causes defective IFN-γ production by S1pr5−/− LN NK cells after infection.

(a, b) 108 CFU Salmonella Typhimurium or PBS (mock) were injected subcutaneously into footpads of S1pr5−/− and littermate control mice. Draining LN were harvested 2h later and IFN-γ production was assessed by flow cytometry.
(a) Representative FACS plots of IFN-γ production, gated on NK1.1+CD3– cells.
(b) Percent IFN-γ positive cells among total NK1.1+CD3– cells. Each symbol represents one mouse; lines indicate the mean.
(c) Mixed bone marrow chimeras (mBMCs) were generated as in Fig. 4f using GFP+ (
 ), CD45.1+ (○), or CD45.1+CD45.2+ (●) mice as WT donors. Mixed chimeras were injected subcutaneously with 108 CFU Salmonella Typhimurium in the footpad. Draining LN were harvested 2 hours later for analysis by flow cytometry. Graph shows the ratio of the [percent IFN-γ+ of CD45.2+ experimental NK cells] to the [percent IFN-γ+ of WT NK cells] in S1pr5−/− mBMCs and S1pr5+/+ control mBMCs. Each symbol represents one mouse; lines indicate the mean and SEM.
(d, e) NK cells isolated from LN of S1pr5−/− or littermate control animals were treated in vitro with IL-15 alone or IL-15, IL-12, and IL-18 (STIM) for 3 hours, and assessed for IFN-γ production by flow cytometry.
(d) Representative FACS plots of IFN-γ production, gated on NK1.1+CD3– cells.
(e) Percent IFN-γ positive cells among total NK1.1+CD3– cells. Each symbol represents the average of duplicate samples from one mouse; lines indicate the mean.
(f, g) 108 CFU Salmonella Typhimurium (ST) or PBS (mock) were injected subcutaneously in footpads of S1pr5−/− and littermate control mice. Draining LN were harvested 2h later for analysis.
(f) Representative sections from draining LN stained with anti-NK1.1 (NK cells, green), anti- IFN-γ (magenta), anti-Lyve1 (LEC and some sinus-lining macrophages, blue), and anti-B220 (B cells, white). Med indicates medulla, T indicates T zone. Scale bars, 100 μm. Insets show NK1.1 and IFN-γ stains in the boxed areas of medulla and T zone. Scale bars, 20 μm. Representative of 9 (littermate control) or 12 (S1pr5−/−) images from 3 pairs of mice in 2 experiments.
(g) Percent IFN-γ+ among total NK cells within the medulla or T zone of draining LN. Mock-treated mice were controls. For the T zone, sections containing fewer than 10 NK cells within the T zone were excluded from analysis. Each symbol represents one section; lines indicate the mean and SEM.
Graphs compile 2–5 mice per condition, analyzed in 4 experiments (b); 12–14 mice per genotype from 7 sets of donors, analyzed in 9 experiments (c); 3 pairs of mice, analyzed in 2 experiments (e); or 3–12 sections from 3 mice per condition analyzed in 2 experiments (g). *, p<0.05; **, p<0.01; ns, p>0.05, not significant. Unpaired Student’s 2-tailed t-test (b, c, e); Fisher’s LSD test (g).
