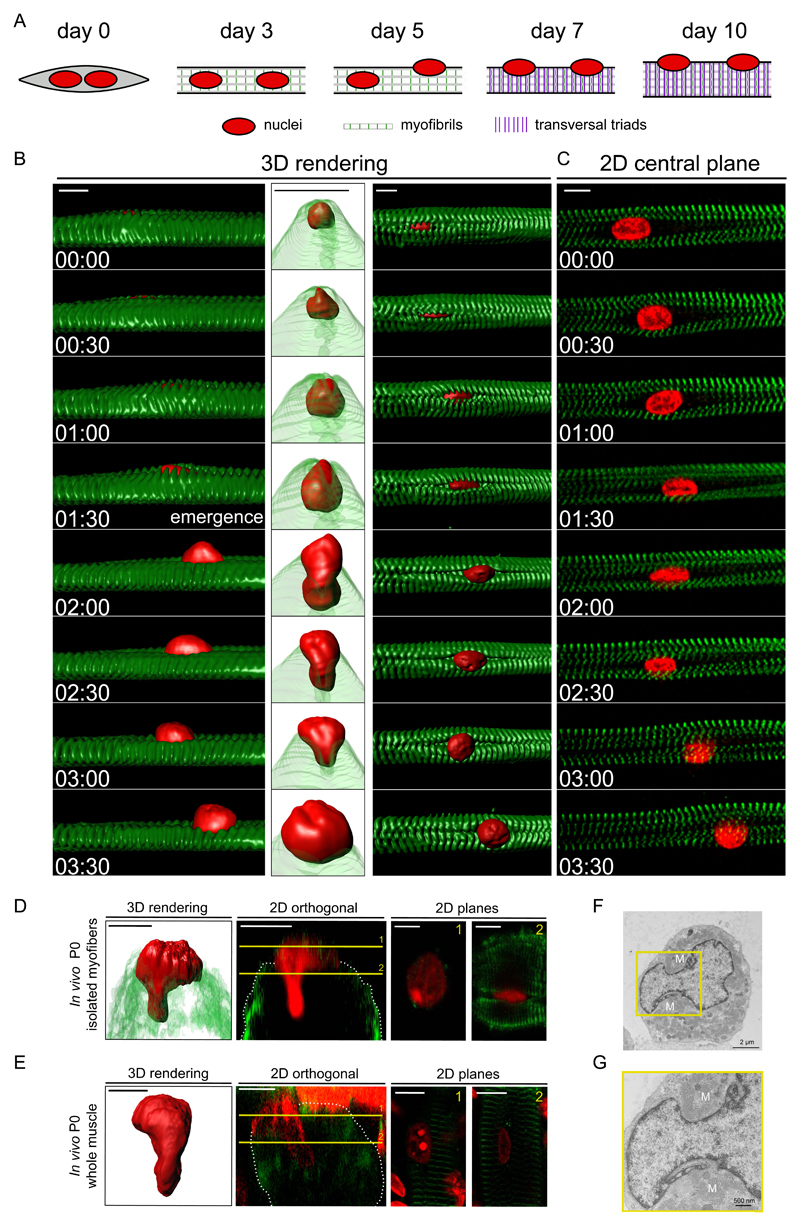
Figure 1. Visualizing nuclear movement to the periphery.
A. Timeline of muscle differentiation in the in vitro system used to study peripheral nuclear positioning and transversal triad formation. Nuclei are in red, myofibrils in white (with z-lines in green) and transversal triads as purple lines. Day 3: myofibril formation. Day 5: initiation of peripheral nuclear positioning. Day 7: transversal triad formation.
B. Kymograph from a time-lapse movie of a 5-day myofiber depicting peripheral movement of a nucleus (H2B-iRFP, red) through myofibrils (YFP-α-actinin, green). Left: view from the side, surface three-dimensional (3D) rendering. Middle: view from the right side, with transparent myofibrils 3D rendering. Right: view from the top, surface three-dimensional rendering. Time, hh:mm. Scale bar, 10 μm.
C. Two dimensional (2D) view of the central plane of a kymograph from a time-lapse movie of a 5-day myofiber depicting peripheral movement of a nucleus (H2B-iRFP, red) through myofibrils (YFP-α-actinin, green). Scale bar, 10 μm.
D. Representative image of a nucleus squeezing to the periphery from an in vivo isolated myofiber of a newborn mouse and stained for myofibrils (α-actinin, green) and nucleus (red). Left: 3D rendering. Middle left: 2D orthogonal view, yellow lines represent slices seen in right side panels. Middle right: 2D plane from yellow slice 1. Right: 2D plane from yellow slice 2. Scale bar, 10 μm. Image shown is representative of 2 experiments.
E. Representative image of a nucleus squeezing to the periphery after performing a clearing protocol of a whole muscle in a newborn mouse and stained for myofibrils (α-actinin, green) and nucleus (red). Left: 3D rendering. Middle left: 2D orthogonal view, yellow lines represent slices seen in right side panels. Middle right: 2D plane from yellow slice 1. Right: 2D plane from yellow slice 2. Scale bar, 10 μm. Image shown is representative of 2 experiments.
F. Transversal electron micrograph of a 4.5 day myofiber showing a nucleus beginning to protrude towards the periphery. Scale bar, 2 µm. “M” annotate myofibrils.
G. Transversal electron micrograph of a 4.5 day myofiber showing a nucleus during budding to the periphery. Scale bar, 500 nm. 4x Magnifications corresponding to the yellow square is shown below the image. “M” annotate myofibrils. Image shown is representative of 4 experiments.

