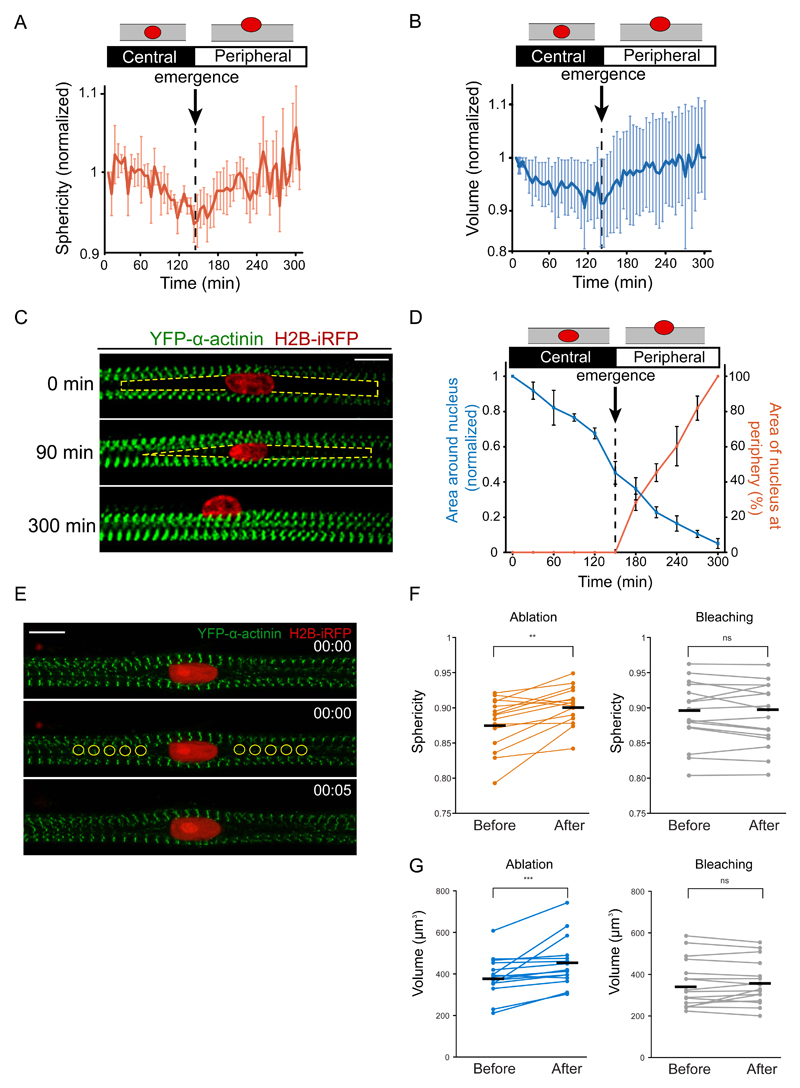
Figure 2. Myofiber cross-linking drives nuclear movement to the periphery.
A. Quantification of the sphericity of nuclei during nuclear movement to the periphery in 5-day myofibers. Dashed line corresponds to the emergence of the nucleus at the myofiber periphery (n = 8 myofibers Data from 6 independent experiments were combined. Error bars correspond to s.e.m. Source data is available in Supplementary Table 3.
B. Quantification of the volume of nuclei during nuclear movement to the periphery in 5-day myofibers. Dashed line corresponds to the emergence of the nucleus at the myofiber periphery (n = 8 myofibers). Data from 6 independent experiments were combined. Error bars correspond to s.e.m. Source data is available in Supplementary Table 3.
C. Kymograph from a time-lapse movie of a 5-day myofiber depicting area around the nucleus in between myofibrils (yellow dashed line) during nuclear movement to the periphery with the nucleus (H2B-iRFP, red) migrating through myofibrils (YFP-α-actinin, green). Scale bar, 10 μm.
D. Quantification of the area in between myofibrils around the nucleus (blue line) and the percentage of area of the nucleus at the periphery over time (orange line) in 5-day myofibers (n = 8 myofibers). Error bars correspond to s.e.m. Source data is available in Supplementary Table 3.
E. Representative images of a 4.5-day myofiber time-lapse movie before and after laser ablation with myofibrils depicted in green (YFP-α-actinin) and the nucleus in red (H2B-iRFP). Yellow circles represent ablation areas performed at 00:00 (hh:mm). Scale bar, 10 μm. Image shown is representative of 6 experiments.
F. Dot plot showing changes in nuclei sphericity before and after ablation (orange) or bleaching (black). Black lines represent the average. Data from 3 independent experiments were combined (n = 15 nuclei). Wilcoxon matched-pairs signed ranked test was used to determine statistical significances, where ** P < 0.01, NS, not significant. Source data is available in Supplementary Table 3.
G. Dot plot showing changes in nuclei sphericity before and after ablation (orange) or bleaching (black). Black lines represent the average. Data from 3 independent experiments were combined and error bars represent s.e.m from (n = 15 nuclei). Wilcoxon matched-pairs signed ranked test was used to determine statistical significances, where *** P < 0.001, NS, not significant. Source data is available in Supplementary Table 3.

