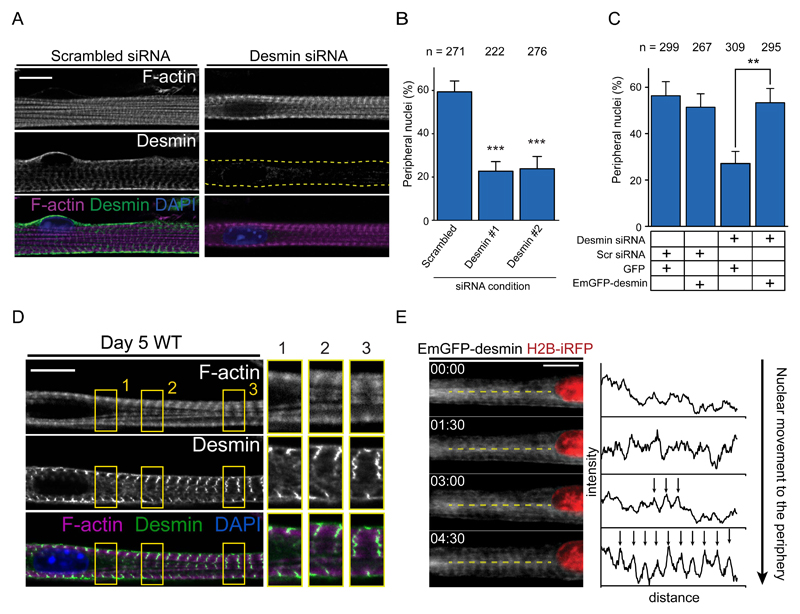
Figure 3. Desmin crosslinks myofibrils to induce nuclear movement to the periphery.
A. Representative immunofluorescence image of a 10-day myofiber knocked down for scrambled or desmin and stained for F-actin (phalloidin, magenta), desmin (green) and DAPI (nucleus, blue). Scale bar, 10 μm.
B. Quantification of peripheral nuclei positioning in 10-day myofibers knocked down for scrambled or desmin. Data from 3 independent experiments were combined and error bars represent s.e.m from indicated n nuclei for each cohort. Unpaired t-test was used to determine statistical significances, where *** P < 0.001. Source data is available in Supplementary Table 3.
C. Quantification of peripheral nuclei positioning and traversal triads in 10-day myofibers knocked down for scrambled or desmin and transfected with either GFP or Em-GFP-desmin. Data from 3 independent experiments were combined and error bars represent s.e.m from indicated n nuclei for each cohort. Unpaired t-test was used to determine statistical significances, where ** P < 0.01.
D. Representative immunofluorescence image of a 4.5-day myofiber knocked stained for F-actin (phalloidin, magenta), desmin (green) and DAPI (nucleus, blue). Arrow indicates organized desmin whereas arrowhead indicates disorganized desmin. 2x Magnifications corresponding to the yellow squares are showed on the right corresponding to areas near the nucleus with disorganized desmin either without (1.) or with myofibrils (2.), or areas away from the nucleus with organized desmin and myofibrils (3.) . Scale bar, 10 μm. Image shown is representative of 3 experiments.
E. Kymograph from a time-lapse movie of a 5-day myofiber depicting desmin organization, Emerald-desmin (EmGFP-desmin, gray) during nuclear movement to the periphery (H2B-iRFP, red). Yellow dashed lines represent the region used to perform line scans plotted on the right. Arrows highlight the transversal organization of desmin. Time, hh:mm. Scale bar, 10 μm. Source data is available in Supplementary Table 3.

