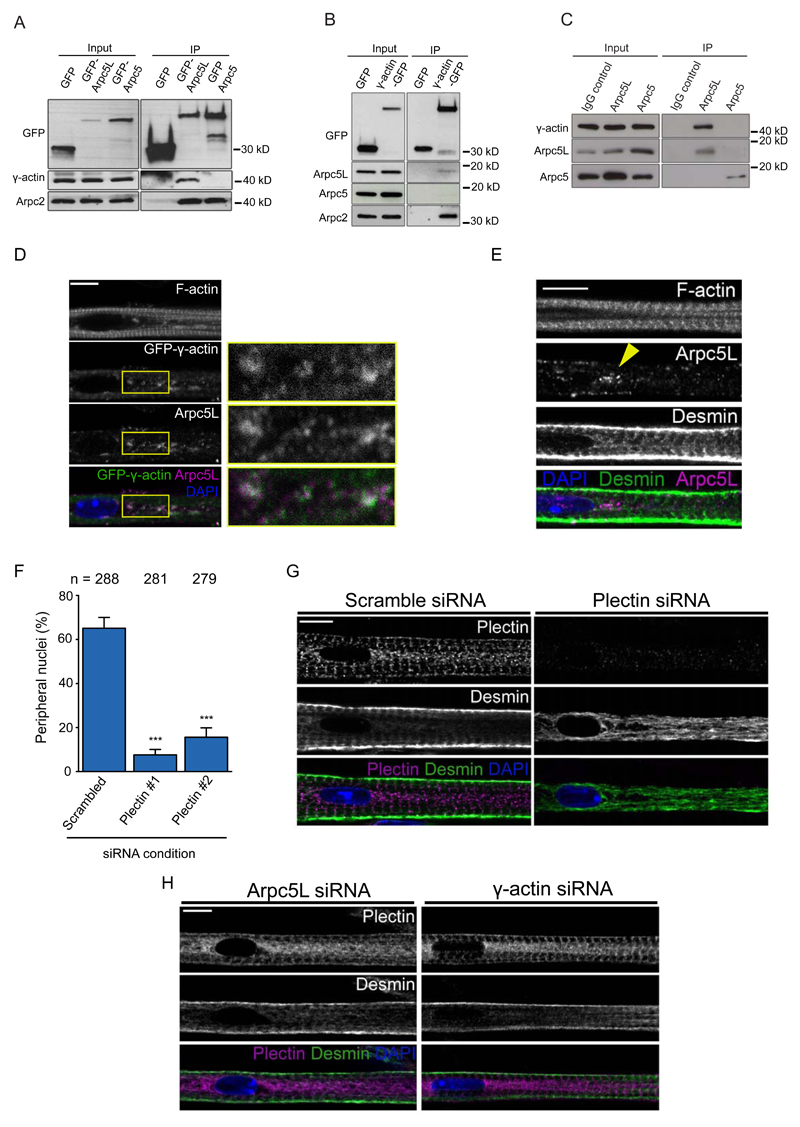
Figure 5. Arpc5L and γ-actin interact to crosslink myofibrils.
A. Western blots with indicated antibodies of GFP, GFP-Arpc5L or GFP-Arpc5 immunoprecipitated from 5-day myofibers. Experiments were performed 3 times.
B. Western blots with indicated antibodies of GFP and GFP-γ-actin immunoprecipitated from 5-day myofibers. Experiments were performed 3 times.
C. Western blots with indicated antibodies of IgG control, Arpc5L and Arpc5 immunoprecipitated from 5-day myofibers. Experiments were performed 3 times.
D. Representative immunofluorescence images of 5-day myofibers expressing GFP-γ-actin (green) and immunostained for Arpc5L (magenta) in 5-day myofibers (left). Scale bar, 10 μm. 3x Magnifications corresponding to the yellow rectangle are shown on the right. Image shown is representative of 3 experiments.
E. Representative immunofluorescence images of 5-day myofibers stained for Arpc5L (magenta), desmin (green) and F-actin. Yellow arrowhead represents area depleted of myofibrils in which desmin is disorganized and Arpc5L is enriched. Scale bar, 10 μm. Image shown is representative of 3 experiments.
F. Quantification of peripheral nuclei positioning in 10-day myofibers knocked down for scrambled or plectin. Data from 3 independent experiments were combined and error bars represent s.e.m from indicated n nuclei for each cohort. Unpaired t-test was used to determine statistical significances, where *** P < 0.001. Source data is available in Supplementary Table 3.
G. Representative immunofluorescence image of a 4.5-day myofiber knocked down for scrambled or plectin and stained for plectin (magenta), desmin (green) and DAPI (nucleus, blue). Scale bar, 10 μm. Image shown is representative of 3 experiments.
H. Representative immunofluorescence image of a 4.5-day myofiber knocked down for Arpc5L or γ-actin and stained for plectin (magenta), desmin (green) and DAPI (nucleus, blue). Scale bar, 10 μm. Image shown is representative of 3 experiments.

