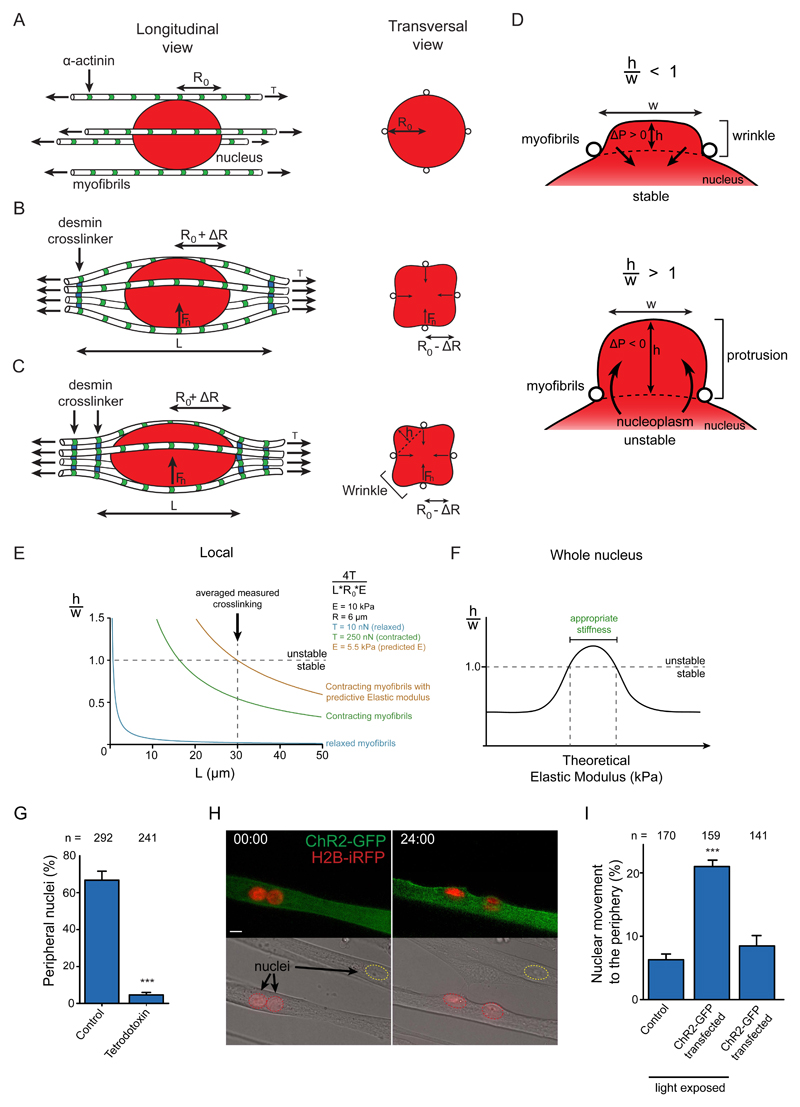
Figure 6. Theoretical model of peripheral nuclear movement.
A-C. Schematic of a nucleus (red) surrounded by myofibrils (white) before (A) and during (B and C) peripheral migration. Longitudinal view (left) and transversal view (right). R0, radius of the undeformed nucleus. ΔR, amplitude of radial deformation. Fn= force applied by myofibrils on the nucleus. L, length between crosslinkers (blue). h, height of a nuclear wrinkle.
D. Transversal schematic of a stable nuclear wrinkle (top) and unstable nuclear protrusion (bottom). w, width of a nuclear wrinkle/protrusion. ΔP, difference in hydrostatic pressure between nucleus and wrinkle upon an increase of h.
E. Model of the stability of wrinkles relative to force on the nucleus. The scaled wrinkle size h/w is plotted as a function of L based on the function 4T/L*R0*E. Above the threshold h/w ≈ 1, the nucleus is moved to the periphery. Different situations are ploted: relaxed myofibrils (blue), contractile myofibrils (green), contractile myofibrils with predicted nucleus Elastic modulus (E) (Orange).
F. Model for the stability of wrinkles relative to global nuclear stiffness, i.e Elastic modulus. The scaled wrinkle size h/w is plotted as a function of global E. The model analyses both large and small E regimes; the intermediate regime is here extrapolated.
G. Quantification of peripheral nuclei positioning in 10-day myofibers treated with tetrodotoxin from day 4.5. Data from 3 independent experiments were combined and error bars represent s.e.m from indicated n nuclei for each cohort. Unpaired t-test was used to determine statistical significances, where *** P < 0.001.
H. Representative images of the first (left) and last (right) frame of a 24-hour time-lapse movie of untransfected as well as ChR2-GFP (green) and H2B-iRFP (red) transfected myofibers exposed to blue light Nuclei from transfected (red dashed line) and untransfected (yellow dashed line) myofibers are indicated. . 00:00 (hh:mm) corresponds to 3.5-day myofibers. Scale bar, 10 μm. Image shown is representative of 4 experiments.
I. Quantification of nuclei migrating to the periphery as in B., and expressing ChR2-GFP not exposed to light. Data from 6 independent experiments were combined and error bars represent s.e.m from indicated n nuclei for each cohort. Unpaired t-test was used to determine statistical significances, where *** P< 0.001. Source data is available in Supplementary Table 3.

