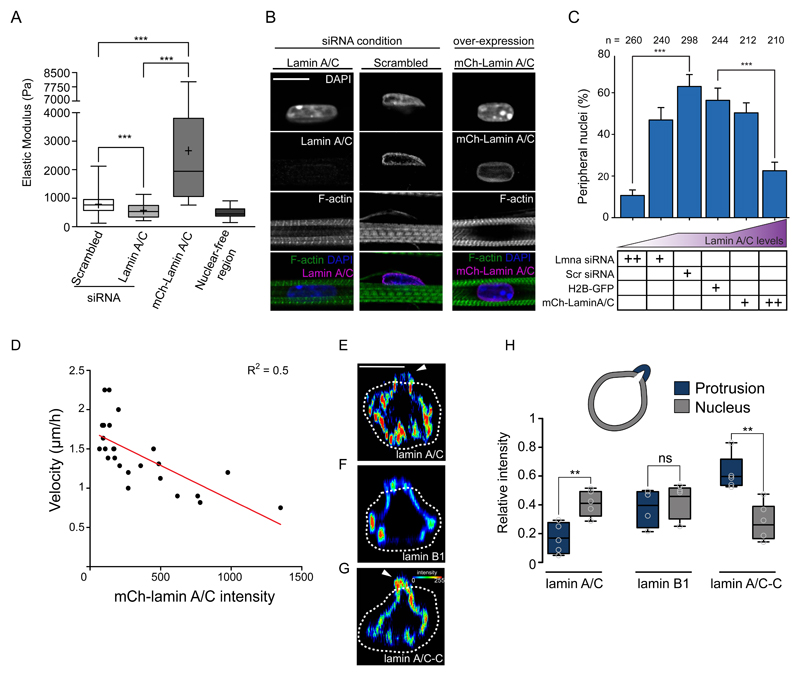
Figure 7. Contraction and nuclear stiffness are involved in nuclear movement to the periphery.
A. Box plot of nuclear stiffness in 5-day myofibers knocked down for scramble or lamin A/C or transfected with mCh-lamin A/C measured by AFM using nuclear-free region as a control. Data from 4 independent experiments were combined and error bars represent s.e.m from at least 90 measurements for each cohort. Unpaired t-test was used to determine statistical significances, where *** P < 0.001. Source data is available in Supplementary Table 3.
B. Representative immunofluorescence images of 10-day myofibers knocked down for lamin A/C, scrambled or over-expressing mCherry-lamin A/C (mCh-lamin A/C) and stained for lamin A/C (magenta), F-actin (green) and DAPI (nucleus, blue). Scale bar, 10 μm. Image shown is representative of 3 experiments.
C. Quantification of peripheral nuclei positioning in 10-day myofibers knocked down for lamin A/C or scrambled, or over-expressing H2B-mCherry or mCherry-lamin A/C. Data from 3 independent experiments were combined and error bars represent s.e.m from indicated n nuclei for each cohort. Unpaired t-test was used to determine statistical significances, where *** P < 0.001. Source data is available in Supplementary Table 3.
D. Plot correlating velocity of nuclear movement to the periphery with the intensity of the mCherry-lamin A/C signal in time-lapse movies of myofibers expressing mCherry-lamin A/C between 4.5 and 5.5 days. Red line corresponds to the significant linear regression, P = 0.0001 of R2 = 0.5004 for n = 24 nuclei. Source data is available in Supplementary Table 3.
E-G. Orthogonal view of nuclei from 5 day myofibers with protrusion initiation, stained with lamin A/C (E), lamin B1 (F) or lamin A/C-C (G) the intensity signal represented as a heat map. White dashed line represents the outline of myofibrils. White arrowheads represent asymmetry nuclear stiffness. Scale bar, 10 μm.
H. Box plot comparing the intensity of lamin A/C, lamin B1 or lamin A/C-C in the part of the nucleus still inside the myofibril bundle (grey: nucleus) versus the forming protrusion (blue: protrusion). Data from 5 independent experiments were combined and error bars represent s.e.m from n = 5 nuclei for each cohort. Unpaired t-test was used to determine statistical significances, where ** P < 0.01, NS, not significant. Box represents the upper and lower quartile, bar represents median and error bars represent maxima and minima. Source data is available in Supplementary Table 3.

