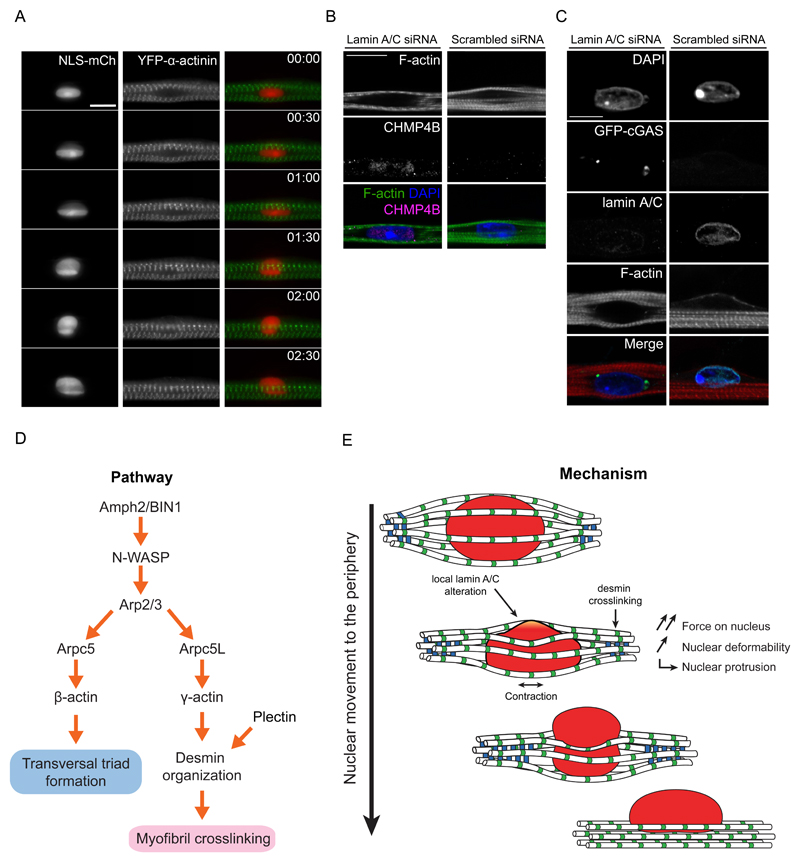
Figure 8. Model of nuclear movement to the periphery in myofibers.
A. Kymograph from a time-lapse movie of a 4-day myofiber depicting movement to the periphery of a nucleus (NLS-mCh, red) surrounded by myofibrils bundles (YFP-α-actinin, green). Note that NLS-mCh is not released from the nucleus to the cytoplasm suggesting that nuclear disruption does not occur during nuclear movement to the periphery. Time, hh:mm. Scale bar, 10 μm.
B. Representative image of 4.5-day myofibers knocked down for lamin A/C or scrambled and stained for myofibrils (F-actin, green), ESCRT III (CHMP4B, magenta) and nucleus (DAPI, blue). Note that the ESCRT complex is not recruited to the nuclear envelope in scramble situation. Lamin A/C siRNA was used as a control. Scale bar, 10 µm. Image shown is representative of 3 experiments.
C. Representative image of 10-day myofibers knocked down for lamin A/C or scrambled and transfected with GFP-cGAS (green) as well as being stained for myofibrils (F-actin, red), lamin A/C (cyan) and nucleus (DAPI, blue). Note that GFP-cGAS is not recruited to the nucleus in scramble situation suggesting that nuclear disruption does not occur. Lamin A/C siRNA was used as a control. Scale bar, 10 µm. Image shown is representative of 3 experiments.
D. Pathway of the molecular players involved in nuclear movement to the periphery and transversal triad formation.
E. Mechanism of nuclear movement to the periphery.

