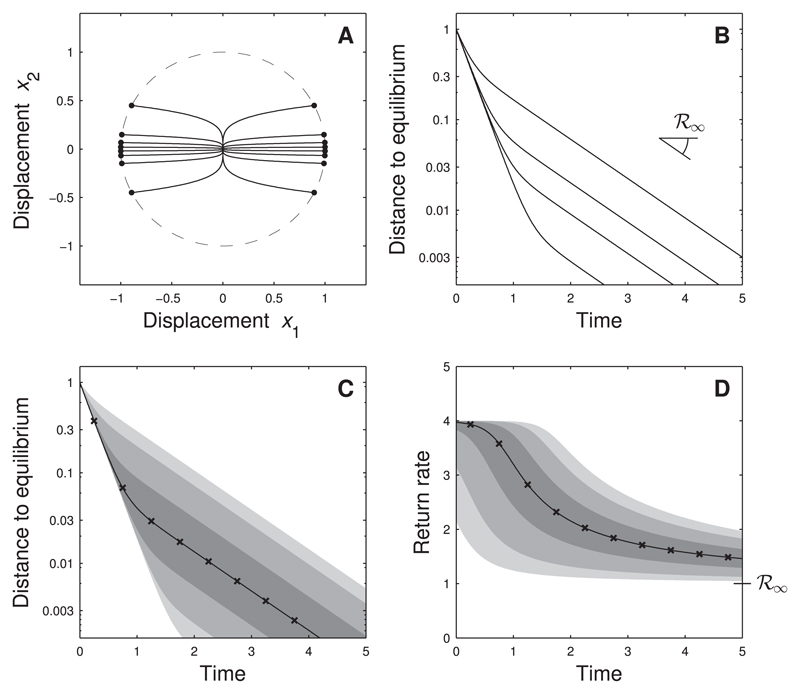
Fig. 4.
Return to equilibrium for biomass-dependent perturbations. Same system as Fig. 2, but here we take into account that perturbations affect abundant and rare species differently. Specifically, we assume that the equilibrium biomass of species 1 (the species with the fastest response) is ten times larger than the equilibrium biomass of species 2. Panel A: phase-plane trajectories for several perturbations u. Perturbations are no longer spread out on the unit circle (dashed line), but tend to be directed along the x1 -axis corresponding to species 1 (dots). Panel B: dynamics of distance to equilibrium. For most perturbations the distance to equilibrium becomes small (below 10% of the pulse perturbation) at a rate equal to the return rate of species 1 (rather than the return rate of species 2, which is equal to asymptotic resilience). Panels C and D: statistics of distance to equilibrium and of return rate taking into account that perturbations tend to displace species 1 more strongly than species 2. As a result, perturbations like the one labeled ‘a’ in Fig. 2 contribute more strongly to the statistics than perturbations like the one labeled ‘b’ in Fig. 2.

