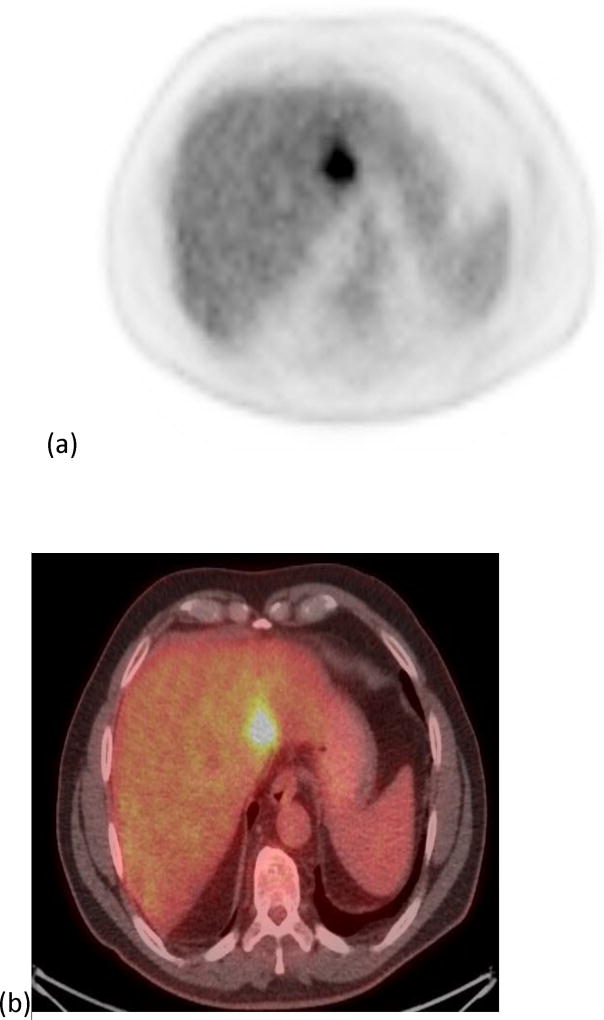
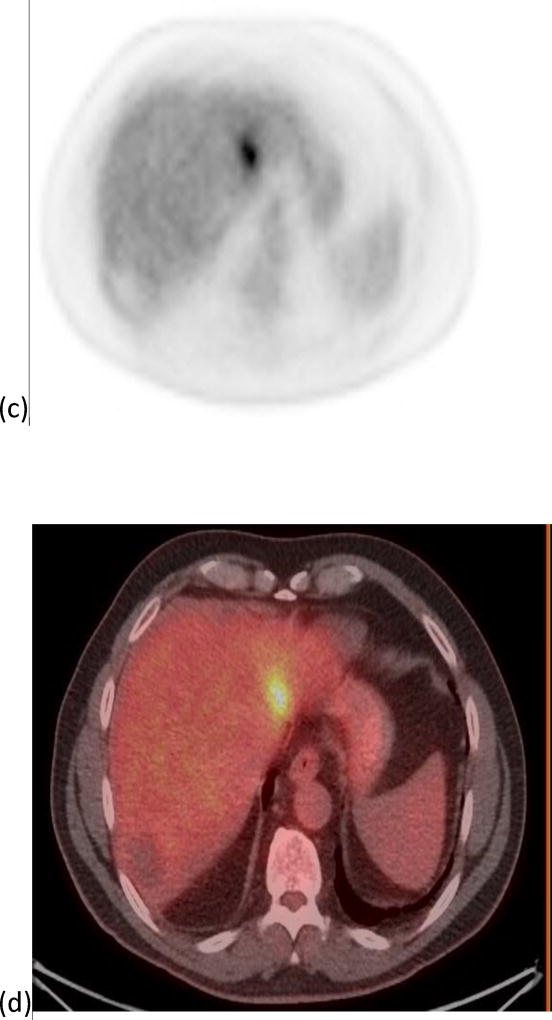
Figure 3.
A 64 year old male with one segment 2 tumor. Images (a) and (b) show the PET and PET/CT fused imaged prior to radioembolization with a SUVmax of 6.36 g/cm3 and a MTV of 18.29 cm3. Images (c) and (d) show the PET and PET/CT fused images post-radioembolization with an increase in SUVmax to 7.0 g/cm3 (10%) and a decrease in MTV to 12.62 cm3 (31%).


